Document 13619610
advertisement
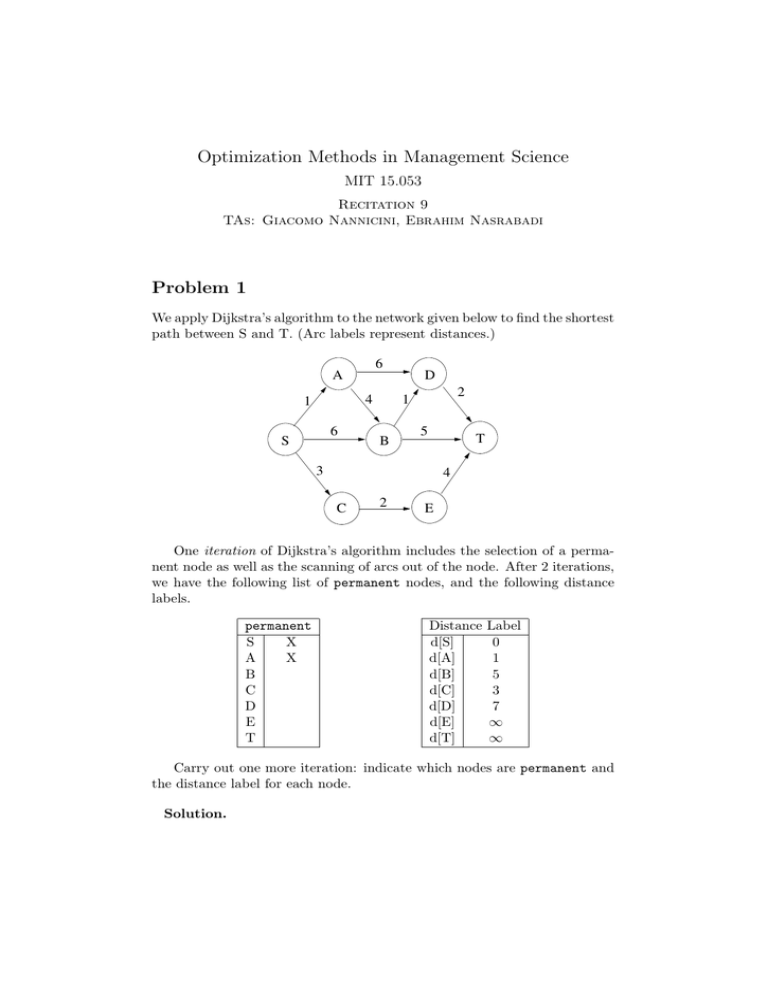
Optimization Methods in Management Science MIT 15.053 Recitation 9 TAs: Giacomo Nannicini, Ebrahim Nasrabadi Problem 1 We apply Dijkstra’s algorithm to the network given below to find the shortest path between S and T. (Arc labels represent distances.) 6 A D 4 1 6 S 2 1 5 T B 3 4 C 2 E One iteration of Dijkstra’s algorithm includes the selection of a perma­ nent node as well as the scanning of arcs out of the node. After 2 iterations, we have the following list of permanent nodes, and the following distance labels. permanent S X A X B C D E T Distance d[S] d[A] d[B] d[C] d[D] d[E] d[T] Label 0 1 5 3 7 ∞ ∞ Carry out one more iteration: indicate which nodes are permanent and the distance label for each node. Solution. Distance d[S] d[A] d[B] d[C] d[D] d[E] d[T] permanent S X A X B C X D E T Label 0 1 5 3 7 5 ∞ Problem 3 Each year, Data Corporal produces as many as 400 computers in Boston and 300 computers in Raleigh. Los Angeles customers must receive 400 computers, and 300 computers must be supplied to Austin customers. Pro­ ducing a computer costs $800 in Boston and $900 in Raleigh. Computers are transported by plane and may be sent through Chicago. The costs of sending a computer between pairs of cities are shown in the following table. From Boston Raleigh Chicago Chicago 80 100 – To Austin 220 140 40 Los Angeles 280 170 50 (a) Formulate a Minimum Cost Network Flow problem that can be used to minimize the total (production + distribution) cost of meeting Data Corporal’s annual demand. Solution. In order to formulate a minimum cost network flow prob­ lem, we need to consider a few questions. First, what does our flow represent? For this problem, a unit of flow in the network will rep­ resent transportation of a single computer. Second, what are our nodes? To start, our nodes will represent the various physical loca­ tions, Boston, Raleigh, Chicago, Austin, and Los Angeles. Third, what are our arcs along with the costs and capacities? Initially, we will create an arc between two physical locations if a computer can be transported from the first location to the second. The cost for these arcs will be the shipment costs described in the table above and each arc will have an unlimited capacity. Fourth, what is our supply and demand? In this case, our supply is the number of computers pro­ duced in Boston and Raleigh and our demand is the customer demand in Los Angeles and Austin. Last, are we missing anything? We sure are! We still have to represent the cost of producing computers. To 2 do that, we’ll add a virtual supply node, with arcs to each of the pro­ duction sites, Boston and Raleigh. The cost for these arcs will be $800 and $900 respectively and the capacities are the production capacities for each location. Additionally, we combine the supply from Boston and Raleigh and move it to our virtual supply node. The resulting network is pictured in Figure 1. ∞ $220 400 700 ∞ B $800 $80 s $280 C ∞ 300 $900 ∞ $100 R ∞ $140 L 400 ∞ $50 ∞ $40 A 300 ∞ $170 Figure 1: Network for Problem 2-Part (a) In the network, capacities, supplies, and demands are listed above the arcs in black and costs are listed below the arcs in green. (b) How would you modify the Part A formulation if at most 200 units could be shipped through Chicago? Solution. To model a capacity on a node, we can split the node in half and add an arc between the two halves. That is, we split node C into nodes C1 and C2, set all of the C incoming arcs to C1, start all of the C outgoing arcs from C2, and add an arc from C1 to C2 with a cost of $0 and a capacity of 200. The updated network is pictured Figure 2. (c) How would you modify the network if 500 computers could be produced in Raleigh instead of 300? This illustrates a general strategy for dealing with excess supply. Solution. To handle the additional supply, we need to create a sink node to balance the supply and demand. We set the demand for the sink node equal to our excess supply. Additionally, we need to create an arc from s to the sink node with cost of $0 and infinite capacity. 3 ∞ $220 400 700 ∞ B $800 $80 $280 ∞ s C1 300 $900 ∞ $100 R L 200 $0 ∞ $140 400 $50 C2 ∞ $40 A 300 ∞ $170 Figure 2: Network for Problem 2-Part (b) Problem 3 Short answer (True or False). 1. For a Minimum Cost Network Flow Problem, a supply of -1 for a node is equivalent to a demand of 1. Solution. True. A supply of -1 (coming into the node) is equiva­ lent to a demand of 1 (going out of the node). Switching the direction on the arrow changes the sign. 2. For a Minimum Cost Network Flow problem, if the specified supply is not equal to the demand (that is, the sum of the bi ’s does not equal 0), the corresponding Linear Program with flow balance equality constraints must be infeasible. Solution. True. The key was to recognize that we are referring to the corresponding Linear Program. That is, the Linear Program without any transformation being done to the original network. In this case, the Linear Program will always be infeasible since the LHS of the flow balance equality constraints will add up to 0 (each arc occurring once positively and once negatively), but the RHS of the flow balance equality constraints (i.e. the sum of the bi’s) does not equal 0. 3. It is possible for an undirected graph to have an Eulerian Path but not an Eulerian Cycle. Solution. True. Say the graph has exactly two odd nodes. 4 4. Suppose all arcs in a network have different lengths. Then the network has a unique shortest path. Solution. False. One simple counterexample is a network with a shortest path of 3. We could have one directed arc from start to finish of length 3, and then another path going through an intermediate node with arc lengths of 1 and 2. Both of these paths would be distinct shortest paths of length 3. Problem 5 Multiple answer 1. Suppose we delete an arc of length k from a graph. Which of the following possibilities can happen to the shortest path from s to t? (a) It could increase by any number between 0 and k. (b) It could increase by a number greater than k. (c) It could possibly become infinite. (d) It could decrease. Solution. i, ii, iii. If we remove an arc of length k, the only one of these possibilities that could not happen is that the shortest path decreases. If the arc was on the shortest path previously, then removing it could cause: i.) if another path exists with length 0 to k longer, ii.) if another path exists with length greater than k longer, or iii.) if no other path exists. 2. Let G = (N, A) be a network withn nodes and m arcs. (i) The maximum number of distinct s-t paths can be greater than 2m. (ii) If m < n − 1, then G is not connected. (iii) If m is odd, then the graph can not contain an Eulerian Cycle. (iv) If m is even, then every s-t cut has an even number of arcs. Solution. i, ii, iii. i) True. Here is an example for i) Imagine a graph with three nodes s, a, t, and 3 arcs from s to a, 7 arcs from a to t, then total there are 10 arcs and 21 s-t paths. ii) True. If a connected graph has n nodes and m = n − 1 arcs, then it is a tree. We know that a tree does not have any cycle and 5 removing any arc would make the tree disconnected. Therefore, any graph with n nodes and less than n − 1 arcs is disconnected. iii) False. Consider a triangle with three nodes and three arcs form­ ing an Eulerian cycle. 6 MIT OpenCourseWare http://ocw.mit.edu 15.053 Optimization Methods in Management Science Spring 2013 For information about citing these materials or our Terms of Use, visit: http://ocw.mit.edu/terms.
