Study Skills Tutoring Program 2014-2015 Academic Report Section 1: Tutoring
advertisement

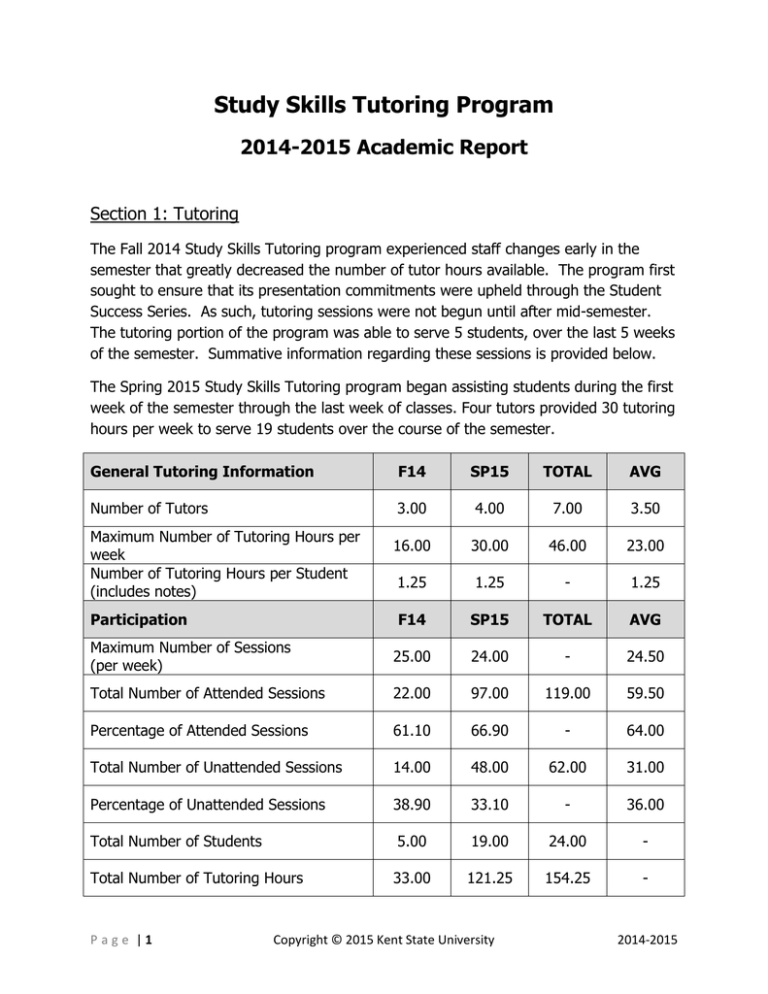
Study Skills Tutoring Program 2014-2015 Academic Report Section 1: Tutoring The Fall 2014 Study Skills Tutoring program experienced staff changes early in the semester that greatly decreased the number of tutor hours available. The program first sought to ensure that its presentation commitments were upheld through the Student Success Series. As such, tutoring sessions were not begun until after mid-semester. The tutoring portion of the program was able to serve 5 students, over the last 5 weeks of the semester. Summative information regarding these sessions is provided below. The Spring 2015 Study Skills Tutoring program began assisting students during the first week of the semester through the last week of classes. Four tutors provided 30 tutoring hours per week to serve 19 students over the course of the semester. General Tutoring Information F14 SP15 TOTAL AVG Number of Tutors 3.00 4.00 7.00 3.50 16.00 30.00 46.00 23.00 1.25 1.25 - 1.25 F14 SP15 TOTAL AVG Maximum Number of Sessions (per week) 25.00 24.00 - 24.50 Total Number of Attended Sessions 22.00 97.00 119.00 59.50 Percentage of Attended Sessions 61.10 66.90 - 64.00 Total Number of Unattended Sessions 14.00 48.00 62.00 31.00 Percentage of Unattended Sessions 38.90 33.10 - 36.00 Total Number of Students 5.00 19.00 24.00 - Total Number of Tutoring Hours 33.00 121.25 154.25 - Maximum Number of Tutoring Hours per week Number of Tutoring Hours per Student (includes notes) Participation Page |1 Copyright © 2015 Kent State University 2014-2015 Section 2: Academic Concerns The Study Skills Tutoring program provided support to students in 9 academic areas including: transition to college, semester planning, time management, note taking, test preparation and taking, active learning strategies, study aids, and the study cycle. Data below compares the academic concerns requested during general tutoring intake versus the academic concern addressed during scheduled sessions. General Intake Session Activity Academic Concern F14 SP15 TOTAL AVG F14 SP15 TOTAL 0.5 Transition to College 2.0 2.0 4.0 2.0 0.0 1.0 1.0 Semester Planning 3.0 6.0 9.0 4.5 0.0 5.0 5.0 Time Management 5.0 15.0 20.0 10.0 9.0 34.0 43.0 Note Taking 2.0 8.0 10.0 5.0 2.0 8.0 10.0 Test Preparation 5.0 13.0 18.0 9.0 3.0 12.0 15.0 Test Taking 3.0 10.0 13.0 6.5 0.0 0.0 0.0 Active Learning Strategies 3.0 11.0 14.0 7.0 0.0 3.0 3.0 Study Aids 4.0 14.0 18.0 9.0 7.0 18.0 25.0 Study Cycle 2.0 11.0 13.0 6.5 1.0 16.0 17.0 Page |2 Copyright © 2015 Kent State University AVG 2.5 21.5 5.0 7.5 0.0 1.5 12.5 8.5 2014-2015 Figure 1: Academic Concerns The following figure shows a graphical representation of the academic concerns requested for support during general tutoring intake compared to the academic concerns addressed during sessions. Time management was the top requested academic concern as well as the most addressed academic concern during sessions accounting for 36% of session activities. Study aids were the second highest requested and addressed academic concern accounting for 21% of session activities. Transition to college, test taking, and active learning strategies were the least requested and addressed academic concern accounting for a combined total of 3% of session activities. Academic Concerns: Intake vs Session Activity Number of requests/activities Intake Session 50 45 40 35 30 25 20 15 10 5 0 Academic Concern Figure 1: This graph shows the relationship between the academic concerns requested for support during general intake compared to the academic concerns addressed during sessions. Multiple academic concerns were requested by each individual student during intake. Page |3 Copyright © 2015 Kent State University 2014-2015 Section 3: Academic Concern Evaluations The Study Skills Tutoring Program utilized the Study Skills Inventory to assess student needs. Due to the obstacles experienced by the program during Fall 2014, Post-Study Skills Inventories were not conducted in order to maximize academic support during sessions. The Spring 2015 Study Skills Tutoring program conducted Pre- & Post-Study Skills Inventories to evaluate program outcomes during the first and last sessions. In all areas of assessment, scores improved from Pre- to Post-Study Skills Inventory. Summative information is listed below. Pre-Study Skill Inventory Post-Study Skills Inventory Academic Concern F14 SP15 AVG SP15 Difference Pre to Post Textbook Reading 18.6 19.5 19.1 27.2 +7.7 Note Taking 12.6 15.3 14.0 19.0 +3.7 Time Management 14.2 14.0 14.1 19.8 +5.8 Test Preparation 36.8 40.8 38.8 43.3 +2.5 Study Aids 22.8 26.0 24.4 33.3 +7.3 Study Cycle 34.5 34.5 34.5 38.2 +3.7 Page |4 Copyright © 2015 Kent State University 2014-2015 Figure 2: Program Evaluations During the 2014-2015 academic year, students participating in the Study Skills Tutoring program were asked to evaluate the effectiveness of the program during the last session of the semester. During this time, data was collected from 8 students. The figure below shows a graphical representation of student responses for the program evaluation. Program Evaluation Survey Responses I feel more comfortable in my ability to succeed in coursework. Tutor demonstrated effective & efficient set of skills in non-subject specific manner. Strongly Agree Agree Skills & strategies fit my needs. Neutral Disagree I have built an effective set of study skills. Strongly Disagree Sessions have been helpful. 0 1 2 3 4 5 6 7 8 Figure 2: The following graph shows the program evaluation responses for the 2014-2015 academic year. The following statements listed were rated by students based on how well the student agreed with the statement. Page |5 Copyright © 2015 Kent State University 2014-2015 Figure 3: Program Outcomes The following figure shows student responses to the program evaluation conducted during the last session of the semester. Students were asked to evaluate all potential outcomes and mark all applicable outcomes experienced as a result of participation in the program. Summative information is shown below. Program Outcomes 15% Increase academic performance 10% Establish study skills goal. 17% 17% Achieve study skills goal. Apply study strategies to all coursework. 7% 19% 15% Manage time efficently. Seek needed resources. Become independent learner. Figure 3: This chart shows the percentage of program outcomes among students who participated in the program evaluations conducted during the last session on the semester for the 2014-2015 academic year. Page |6 Copyright © 2015 Kent State University 2014-2015 Section 4: Student Success Series Presentations During Fall 2014, the Study Skills Tutoring Program partnered with Student Success Programs to offer 12 academically focused presentations through the Student Success Series. During Spring 2015, the Study Skills Tutoring Program partnered with Student Success Programs again to offer 7 academically focused presentations through the Student Success Series. Summative information regarding these presentations is listed below. General Presentation Information F14 SP15 TOTAL AVG Total Number of Presentations Facilitated 12.00 7.00 19.00 9.50 Total Number of Topics Offered 4.00 4.00 4.00 - Total Number of Presentation Hours 18.00 7.00 25.00 12.50 Number of Hours per Presentation 1.50 1.00 - 1.25 Presentation Registration F14 SP15 Total AVG 360.00 210.00 570.00 285.00 286.00 54.00 340.00 170.00 79.44 25.70 - 52.57 30.00 30.00 - 30.00 23.83 7.70 31.53 15.77 F14 SP15 Total AVG Maximum Number of Students Registered 180.00 54.00 234.00 117.00 Total Number of Students Attended 97.00 46.00 143.00 71.50 53.88 85.18 - 69.53 16.67 6.57 23.24 11.62 Maximum Number of Possible Students Registered Total Number of Actual Students Registered Percentage of Student Registered per Presentation Maximum Number of Students per Presentation Mean Number of Students Registered per Presentation Presentation Attendance Percentage of Student Attendance per Presentation (compared to registration) Mean Number of Students Attended per Presentation Page |7 Copyright © 2015 Kent State University 2014-2015 Figure 4: Student Success Series Presentation Attendance The following figure provides a graphical representation of the presentation attendance versus registration for the 2014-2015 academic year. On average, 85.18% of registrants attended presentations in Spring 2015 and 53.88% of registrants attended presentations in Fall 2014. This data is comparable and shows a 31.3% increase in registrant attendance from Fall 2014 to Spring 2015. This figure also demonstrates the significant difference in registration and attendance between the two semesters. On average, 16.67 registrants attended presentations during Fall 2014 compared to 6.57 attended registrants during Spring 2015. Student Success Presentations: Attended vs Registered 35 Number of Students 30 25 20 15 10 5 0 Preparing for Study Cycle + Study Cycle + Time Time Winding Winding a Successful Time Time Management Management Down, but Not Down, but Not Semester Management Management Wearing Out Wearing Out Presentation Topic SP15 Registered Student SP15 Attendend Students F14 Registered Students F14 Attended Students Figure 4: This graph shows the relationship between registration and attendance for Student Success Presentations for Fall 2014 and Spring 2015 semesters. Fall 2014 data is based on the last 6 presentations of the 12 presentations facilitated and 14 presentations scheduled for the semester. Spring 2015 data is based on 7 presentations facilitated of the 8 presentations scheduled for the semester. Page |8 Copyright © 2015 Kent State University 2014-2015 Section 5: Spring 2015 Requested Presentations The Study Skills Tutoring Program facilitated 7 presentations by request from various campus organizations. Presentations offered include: ASC Overview, Preparing for a Successful Semester, Study Cycle + Time Management, Time Management, Winding Down but Not Wearing Out. Summative information regarding these presentations is listed below. General Presentation Information SP15 Total Number of Presentations Facilitated 7.00 Total Number of Topics Offered 5.00 Total Number of Presentation Hours 8.32 Average Number of Hours per Presentation 1.19 Presentation Attendance SP15 Total Number of Students Attended 97.00 Mean Number of Students Attended per Presentation 13.86 Page |9 Copyright © 2015 Kent State University 2014-2015

