Key Canadian Electricity Statistics (release March 21, 2012)
advertisement

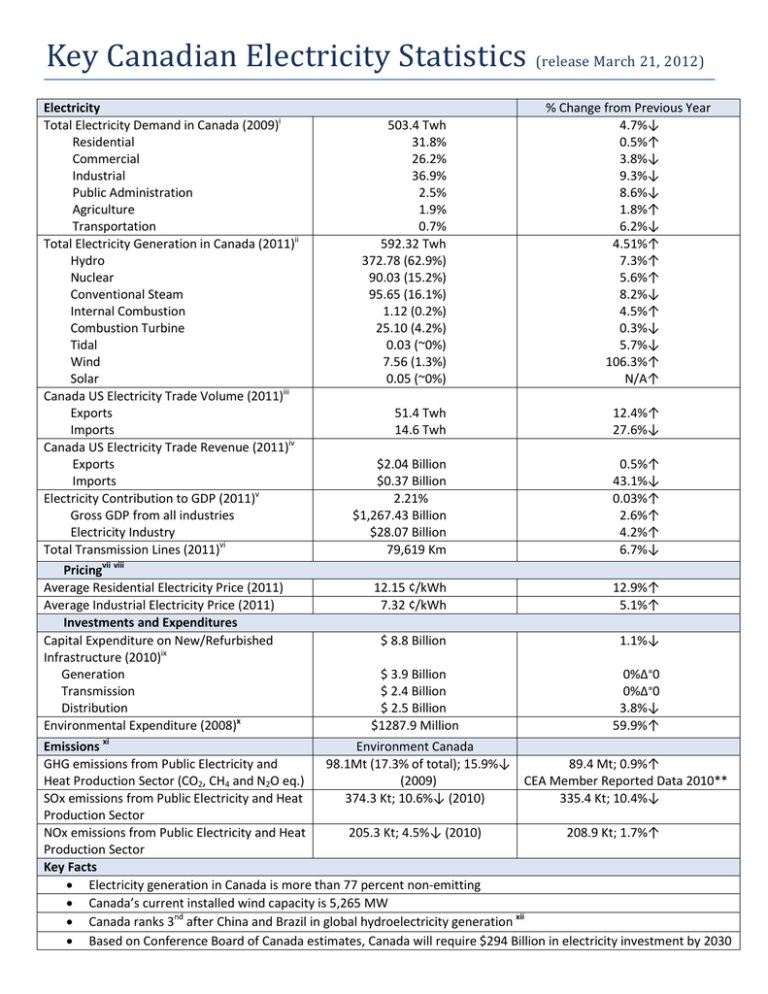
Key Canadian Electricity Statistics (release March 21, 2012) Electricity Total Electricity Demand in Canada (2009)i Residential Commercial Industrial Public Administration Agriculture Transportation Total Electricity Generation in Canada (2011)ii Hydro Nuclear Conventional Steam Internal Combustion Combustion Turbine Tidal Wind Solar Canada US Electricity Trade Volume (2011)iii Exports Imports Canada US Electricity Trade Revenue (2011)iv Exports Imports Electricity Contribution to GDP (2011)v Gross GDP from all industries Electricity Industry Total Transmission Lines (2011)vi Pricingvii viii Average Residential Electricity Price (2011) Average Industrial Electricity Price (2011) Investments and Expenditures Capital Expenditure on New/Refurbished Infrastructure (2010)ix Generation Transmission Distribution Environmental Expenditure (2008)x 503.4 Twh 31.8% 26.2% 36.9% 2.5% 1.9% 0.7% 592.32 Twh 372.78 (62.9%) 90.03 (15.2%) 95.65 (16.1%) 1.12 (0.2%) 25.10 (4.2%) 0.03 (~0%) 7.56 (1.3%) 0.05 (~0%) % Change from Previous Year 4.7%↓ 0.5%↑ 3.8%↓ 9.3%↓ 8.6%↓ 1.8%↑ 6.2%↓ 4.51%↑ 7.3%↑ 5.6%↑ 8.2%↓ 4.5%↑ 0.3%↓ 5.7%↓ 106.3%↑ N/A↑ 51.4 Twh 14.6 Twh 12.4%↑ 27.6%↓ $2.04 Billion $0.37 Billion 2.21% $1,267.43 Billion $28.07 Billion 79,619 Km 0.5%↑ 43.1%↓ 0.03%↑ 2.6%↑ 4.2%↑ 6.7%↓ 12.15 ¢/kWh 7.32 ¢/kWh 12.9%↑ 5.1%↑ $ 8.8 Billion 1.1%↓ $ 3.9 Billion $ 2.4 Billion $ 2.5 Billion $1287.9 Million 0%∆⁼0 0%∆⁼0 3.8%↓ 59.9%↑ Emissions xi Environment Canada GHG emissions from Public Electricity and 98.1Mt (17.3% of total); 15.9%↓ 89.4 Mt; 0.9%↑ Heat Production Sector (CO2, CH4 and N2O eq.) (2009) CEA Member Reported Data 2010** SOx emissions from Public Electricity and Heat 374.3 Kt; 10.6%↓ (2010) 335.4 Kt; 10.4%↓ Production Sector NOx emissions from Public Electricity and Heat 205.3 Kt; 4.5%↓ (2010) 208.9 Kt; 1.7%↑ Production Sector Key Facts Electricity generation in Canada is more than 77 percent non-emitting Canada’s current installed wind capacity is 5,265 MW Canada ranks 3nd after China and Brazil in global hydroelectricity generation xii Based on Conference Board of Canada estimates, Canada will require $294 Billion in electricity investment by 2030 Total Electricity Generation in Canada by province and type(2011) Province Hydro Newfoundland and Labrador (40.7 Twh (6.9%)) 39.4 Twh (96.7%) Nuclear Prince Edward Island (0.5 Twh (0.1%)) Conventional Steam 0.9 Twh (2.2%) Internal Combustion 0.1 Twh (0.1%) Combustion Turbine 0.3 Twh (0.7%) ~0 Twh (0.1%) ~0 Twh (0%) ~0 Twh (-0.1%) 0.5 Twh (100%) New Brunswick (11.2 Twh (1.9%)) Quebec (196.7 Twh (33.2%)) 3.8 Twh (34.0%) ~0 Twh (-0.4%) 5.0 Twh (44.3%) ~0 Twh (0%) 1.9 Twh (16.9%) 0.6 Twh (5.2%) 191.3 Twh (97.2%) 34.7 Twh (24.7%) 3.3 Twh (1.7%) 1.1 Twh (0.5%) 0.3 Twh (0.2%) 0.2 Twh (0.1%) 0.6 Twh (0.3%) 86.8 Twh (61.8%) 8.0 Twh (5.7%) ~0 Twh (0%) 8.6 Twh (6.1%) 2.2 Twh (1.6%) 34.2 Twh (98.4%) 0.1 Twh (0.4%) ~0 Twh (0%) ~0 Twh (0.1%) 0.4 Twh (1.1%) Saskatchewan (23.1 Twh (3.9%)) 4.6 Twh (20.1%) 16.3 Twh (70.5%) ~0 Twh (0%) 1.5 Twh (6.3%) 0.7 Twh (3.1%) Alberta (66.0 Twh (11.1%)) 1.8 Twh (2.8%) 50.9 Twh (77.1%) 0.1 Twh (0.1%) 11.0 Twh (16.7) 2.2 Twh (3.3%) 61.2 Twh (92.1%) 4.1 Twh (6.1%) 0.1 Twh (0.1%) 1.1 Twh (1.7%) British Columbia (66.4 Twh (11.2%)) Yukon (0.4 Twh (0.1%)) 0.4 Twh (90.9%) ~0 Twh (9.0%) Northwest Territories (0.7 Twh (0.1%)) 0.3 Twh (36.8%) 0.3 Twh (46.6%) Nunavut (0.2 Twh (~0 %)) Solar 0.1 Twh (0.3%) 1.1 Twh (9.9%) Manitoba (34.8 Twh (5.9%)) 0.4 Twh (3.8%) Wind Nova Scotia (11.2 Twh (1.9%)) Ontario (140.4 Twh (23.7%)) 9.3 Twh (83.0%) Tidal ~0 Twh (0.2%) 0.3 Twh (3.1%) 0.1 Twh (~0%) ~0 Twh (0.1%) 0.1 Twh (16.6%) 0.2 Twh (100%) *Updated February 2012 ** CEA Corporate Utilities Members, excluding City of Medicine Hat, Oakville Hydro Corporation and Saskatoon Light and power i Energy Statistics Handbook, 4Q 2009. Table 8.7-1; Industrial includes manufacturing and mining/gas/oil extraction (no updates to this data by February 15, 2012). Please note that some CANSIM related tables are terminated and future updates, when available, may relate to CANSIM tables 128-0016 and 128-0017. Also, as per http://www.statcan.gc.ca/daily-quotidien/120113/dq120113b-eng.htm, “The 2010 issue of Report on Energy Supply and Demand in Canada (57-003-X, free) will soon be available”. Public Administration: Establishments of federal, provincial and municipal governments primarily engaged in activities associated with public administration. Establishments included are the Federal Public Service, National Defence, Royal Canadian Mounted Police and provincial and local administrations. North American Industry Classification System (NAICS) code 91. ii Statistics Canada, CANSIM table 127-0002, annual total electricity generation from utilities and industries, based on monthly data, retrieved March 21, 2012 from http://www5.statcan.gc.ca/cansim/a05?lang=eng&id=1270002 (Definitions: “A utility is an organization that, as its prime purpose, generates, transmits and/or distributes electric energy for sale. It can be private or public (provincial or municipal).” Industries are “establishments that are not part of the electric power generation, transmission and distribution industry (North American Industry Classification System (NAICS): 22111).” Conventional Steam Turbine: A power plant in which the prime mover is a steam turbine. The steam used to drive the turbine is produced in a boiler where fossil fuels or other combustible materials are burned; Internal Combustion: A power plant in which the prime mover is an internal combustion turbine. Electric power is generated by the rapid burning of a fuel-air mixture into mechanical energy; Combustion Turbine: A power plant in which the prime mover is a combustion turbine. Electric power is generated by the burning of a fuel into mechanical energy. iii National Energy Board, Electricity Exports, Imports and Statistics, see http://www.neb-one.gc.ca/clfnsi/rnrgynfmtn/sttstc/lctrctyxprtmprt/lctrctyxprtmprt-eng.html#s2011, retrieved February 21, 2012 iv National Energy Board, Electricity Exports, Imports and Statistics, see http://www.neb-one.gc.ca/clfnsi/rnrgynfmtn/sttstc/lctrctyxprtmprt/lctrctyxprtmprt-eng.html#s2011, retrieved February 21, 2012 v Statistics Canada, CANSIM table 379-0027, average based on monthly data on Gross domestic product (GDP) at basic prices, by North American Industry Classification System (NAICS), seasonally adjusted for annual rates, at constant 2002 dollar prices. Retrieved on March 2, 2012 from http://www5.statcan.gc.ca/cansim/a26?lang=eng&retrLang=eng&id=3790027 vi North American Reliability Corporation (NERC) vii Hydro Quebec, Comparison of Electricity Prices in Major North American Cities, 2010, pg. 20; retrieved February 15, 2012 from http://www.hydroquebec.com/publications/en/comparison_prices/pdf/comp_2010_en.pdf, residential average price based on information for Canadian cities as of April 1, 2010 in Canadian dollars, excluding taxes; industrial average price based on information for 12 Canadian cities for large power industries (5,000 kW) based on supply voltage of 25v viii Hydro Quebec, Comparison of Electricity Prices in Major North American Cities, 2011, pg. 20; retrieved February 15, 2012 from http://www.hydroquebec.com/publications/en/comparison_prices/pdf/comp_2011_en.pdf, residential average price based on information for 12 Canadian cities as of April 1, 2011 in Canadian dollars, excluding taxes; industrial average price based on information for Canadian cities for large power industries (5,000 kW) based on supply voltage of 25v; residential price increase from 2010 to 2011 is mainly due to price increases in Calgary (10.65 to 17.47 ¢/kWh) and Edmonton (9.27 to 16.4¢/kWh) ix Canadian Electricity Association (CEA), Sustainable Electricity Annual Report, 2010 x Statistics Canada, CANSIM table 153-0052, retrieved February 16, 2012 from http://www5.statcan.gc.ca/cansim/a26?lang=eng&retrLang=eng&id=1530052, providing total combined capital and operating expenditures on environmental protection for electric power generation, transmission and distribution industry xi United Nations Framework Convention for climate change (UNFCCC), 2011 Annex Party GHG Inventory Submissions for Canada, Common Reporting Format (CRF) for 2009 and 2008, version, titled CAN-2011-2009-v1.2 and CAN-2011-2008-v1.2, sheet tab Table 1s1, Table 1 – Sectoral Report for Energy, for public electricity and heat production (1.a), provided for CO2 (97,413.42 Gg), CH4 (4.90 Gg) and N2O (1.85 Gg) combined upon conversion to CO2 eq emissions for CH4 and N2O, dated 17 October 2011 for GHG emissions http://unfccc.int/national_reports/annex_i_ghg_inventories/national_inventories_submissions/items/5888.php, SOx and NOx data from Environment Canada, National Pollutant Release Inventory, 2010 Air pollutant emissions summary for Canada, retrieved February 24, 2012 from http://www.ec.gc.ca/inrpnpri/default.asp?lang=En&n=F98AFAE7-1; percent difference 2009 vs. 2010 compared to 2009 data available from National Inventory Report, Greenhouse Gas Sources and Sinks in Canada, 2009, Part 2, Annex 10 for Ozone and Aerosol Precursors, pg. 208; 2010 data for GHG emissions from Canadian Electricity Association (CEA), Sustainable Electricity Annual Report, 2010; emissions represent total gross annual direct CO2 eq emissions from fossil fuel generation (tonnes); percent difference 2009 vs. 2010 data based also on CEA summary from member reported data in 2009 and 2010. xii Centre for Energy, Retrieved from http://www.centreforenergy.com/AboutEnergy/CanadianEnergy, on March 9, 2012


