2.693 (13.998) - Water Properties – Calibration Laboratories 6 and... 1. Pressure Sensor Calibration:
advertisement

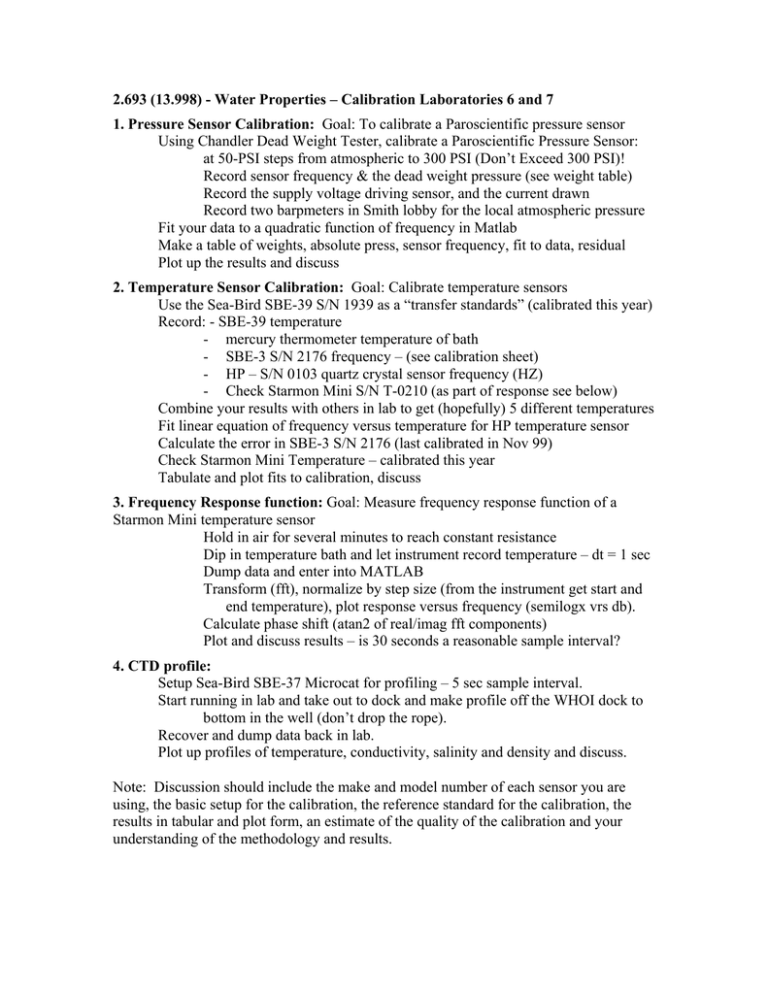
2.693 (13.998) - Water Properties – Calibration Laboratories 6 and 7 1. Pressure Sensor Calibration: Goal: To calibrate a Paroscientific pressure sensor Using Chandler Dead Weight Tester, calibrate a Paroscientific Pressure Sensor: at 50-PSI steps from atmospheric to 300 PSI (Don’t Exceed 300 PSI)! Record sensor frequency & the dead weight pressure (see weight table) Record the supply voltage driving sensor, and the current drawn Record two barpmeters in Smith lobby for the local atmospheric pressure Fit your data to a quadratic function of frequency in Matlab Make a table of weights, absolute press, sensor frequency, fit to data, residual Plot up the results and discuss 2. Temperature Sensor Calibration: Goal: Calibrate temperature sensors Use the Sea-Bird SBE-39 S/N 1939 as a “transfer standards” (calibrated this year) Record: - SBE-39 temperature - mercury thermometer temperature of bath - SBE-3 S/N 2176 frequency – (see calibration sheet) - HP – S/N 0103 quartz crystal sensor frequency (HZ) - Check Starmon Mini S/N T-0210 (as part of response see below) Combine your results with others in lab to get (hopefully) 5 different temperatures Fit linear equation of frequency versus temperature for HP temperature sensor Calculate the error in SBE-3 S/N 2176 (last calibrated in Nov 99) Check Starmon Mini Temperature – calibrated this year Tabulate and plot fits to calibration, discuss 3. Frequency Response function: Goal: Measure frequency response function of a Starmon Mini temperature sensor Hold in air for several minutes to reach constant resistance Dip in temperature bath and let instrument record temperature – dt = 1 sec Dump data and enter into MATLAB Transform (fft), normalize by step size (from the instrument get start and end temperature), plot response versus frequency (semilogx vrs db). Calculate phase shift (atan2 of real/imag fft components) Plot and discuss results – is 30 seconds a reasonable sample interval? 4. CTD profile: Setup Sea-Bird SBE-37 Microcat for profiling – 5 sec sample interval. Start running in lab and take out to dock and make profile off the WHOI dock to bottom in the well (don’t drop the rope). Recover and dump data back in lab. Plot up profiles of temperature, conductivity, salinity and density and discuss. Note: Discussion should include the make and model number of each sensor you are using, the basic setup for the calibration, the reference standard for the calibration, the results in tabular and plot form, an estimate of the quality of the calibration and your understanding of the methodology and results.
