Document 13580214
advertisement
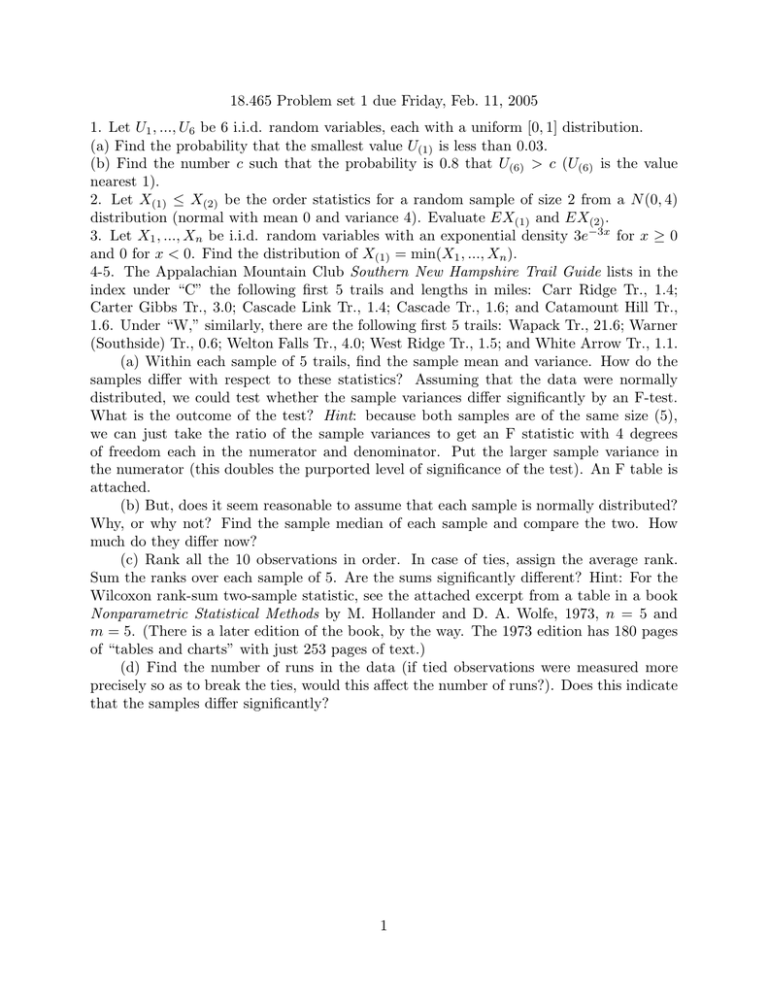
18.465 Problem set 1 due Friday, Feb. 11, 2005 1. Let U1 , ..., U6 be 6 i.i.d. random variables, each with a uniform [0, 1] distribution. (a) Find the probability that the smallest value U(1) is less than 0.03. (b) Find the number c such that the probability is 0.8 that U(6) > c (U(6) is the value nearest 1). 2. Let X(1) ≤ X(2) be the order statistics for a random sample of size 2 from a N (0, 4) distribution (normal with mean 0 and variance 4). Evaluate EX(1) and EX(2). 3. Let X1 , ..., Xn be i.i.d. random variables with an exponential density 3e−3x for x ≥ 0 and 0 for x < 0. Find the distribution of X(1) = min(X1 , ..., Xn). 4-5. The Appalachian Mountain Club Southern New Hampshire Trail Guide lists in the index under “C” the following first 5 trails and lengths in miles: Carr Ridge Tr., 1.4; Carter Gibbs Tr., 3.0; Cascade Link Tr., 1.4; Cascade Tr., 1.6; and Catamount Hill Tr., 1.6. Under “W,” similarly, there are the following first 5 trails: Wapack Tr., 21.6; Warner (Southside) Tr., 0.6; Welton Falls Tr., 4.0; West Ridge Tr., 1.5; and White Arrow Tr., 1.1. (a) Within each sample of 5 trails, find the sample mean and variance. How do the samples differ with respect to these statistics? Assuming that the data were normally distributed, we could test whether the sample variances differ significantly by an F-test. What is the outcome of the test? Hint: because both samples are of the same size (5), we can just take the ratio of the sample variances to get an F statistic with 4 degrees of freedom each in the numerator and denominator. Put the larger sample variance in the numerator (this doubles the purported level of significance of the test). An F table is attached. (b) But, does it seem reasonable to assume that each sample is normally distributed? Why, or why not? Find the sample median of each sample and compare the two. How much do they differ now? (c) Rank all the 10 observations in order. In case of ties, assign the average rank. Sum the ranks over each sample of 5. Are the sums significantly different? Hint: For the Wilcoxon rank-sum two-sample statistic, see the attached excerpt from a table in a book Nonparametric Statistical Methods by M. Hollander and D. A. Wolfe, 1973, n = 5 and m = 5. (There is a later edition of the book, by the way. The 1973 edition has 180 pages of “tables and charts” with just 253 pages of text.) (d) Find the number of runs in the data (if tied observations were measured more precisely so as to break the ties, would this affect the number of runs?). Does this indicate that the samples differ significantly? 1
