Document 13575481
advertisement
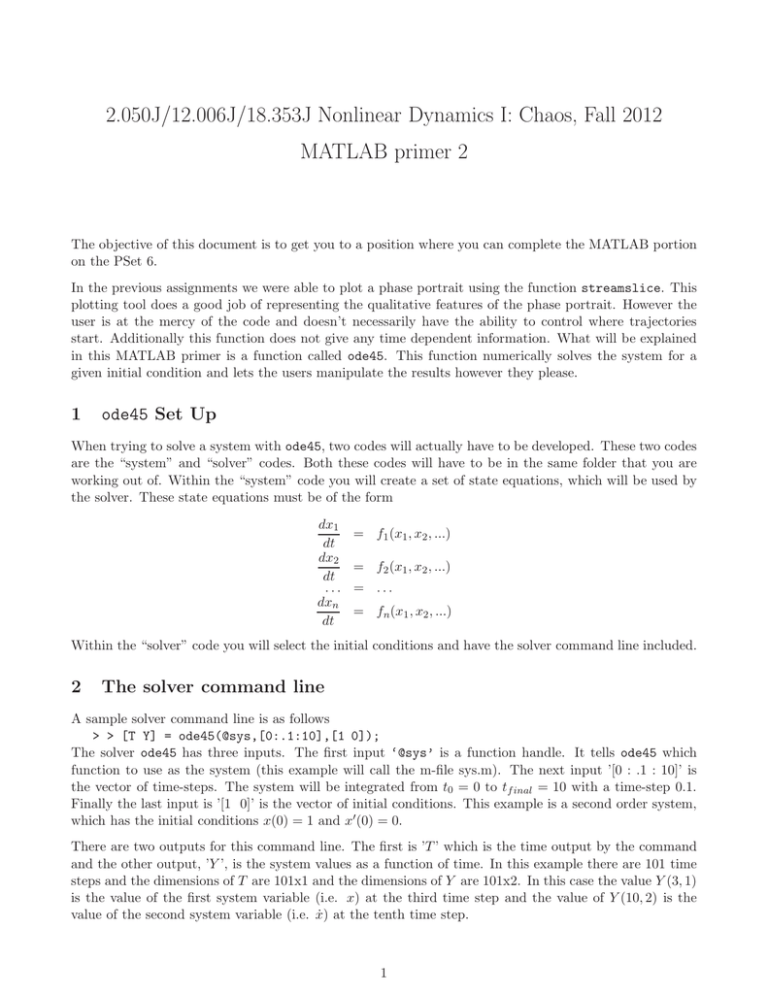
2.050J/12.006J/18.353J Nonlinear Dynamics I: Chaos, Fall 2012 MATLAB primer 2 The objective of this document is to get you to a position where you can complete the MATLAB portion on the PSet 6. In the previous assignments we were able to plot a phase portrait using the function streamslice. This plotting tool does a good job of representing the qualitative features of the phase portrait. However the user is at the mercy of the code and doesn’t necessarily have the ability to control where trajectories start. Additionally this function does not give any time dependent information. What will be explained in this MATLAB primer is a function called ode45. This function numerically solves the system for a given initial condition and lets the users manipulate the results however they please. 1 ode45 Set Up When trying to solve a system with ode45, two codes will actually have to be developed. These two codes are the “system” and “solver” codes. Both these codes will have to be in the same folder that you are working out of. Within the “system” code you will create a set of state equations, which will be used by the solver. These state equations must be of the form dx1 dt dx2 dt ... dxn dt = f1 (x1 , x2 , ...) = f2 (x1 , x2 , ...) = ... = fn (x1 , x2 , ...) Within the “solver” code you will select the initial conditions and have the solver command line included. 2 The solver command line A sample solver command line is as follows > > [T Y] = ode45(@sys,[0:.1:10],[1 0]); The solver ode45 has three inputs. The first input ‘@sys’ is a function handle. It tells ode45 which function to use as the system (this example will call the m-file sys.m). The next input ’[0 : .1 : 10]’ is the vector of time-steps. The system will be integrated from t0 = 0 to tf inal = 10 with a time-step 0.1. Finally the last input is ’[1 0]’ is the vector of initial conditions. This example is a second order system, which has the initial conditions x(0) = 1 and x′ (0) = 0. There are two outputs for this command line. The first is ’T ’ which is the time output by the command and the other output, ’Y ’, is the system values as a function of time. In this example there are 101 time steps and the dimensions of T are 101x1 and the dimensions of Y are 101x2. In this case the value Y (3, 1) is the value of the first system variable (i.e. x) at the third time step and the value of Y (10, 2) is the value of the second system variable (i.e. ẋ) at the tenth time step. 1 5 4 3 2 Y 1 0 −1 −2 −3 −4 −5 −6 −4 −2 0 X 2 4 6 Figure 1: Phase plane created using ode45 starting a variety of initial conditions 5 4 3 2 Y 1 0 −1 −2 −3 −4 −5 −6 −4 −2 0 X 2 4 6 Figure 2: Phase plane created using streamslice starting a variety of initial conditions 2 MIT OpenCourseWare http://ocw.mit.edu 18.353J / 2.050J / 12.006J Nonlinear Dynamics I: Chaos Fall 2012 For information about citing these materials or our Terms of Use, visit: http://ocw.mit.edu/terms.
