2012 – Course 12.744: Problem Set #3
advertisement
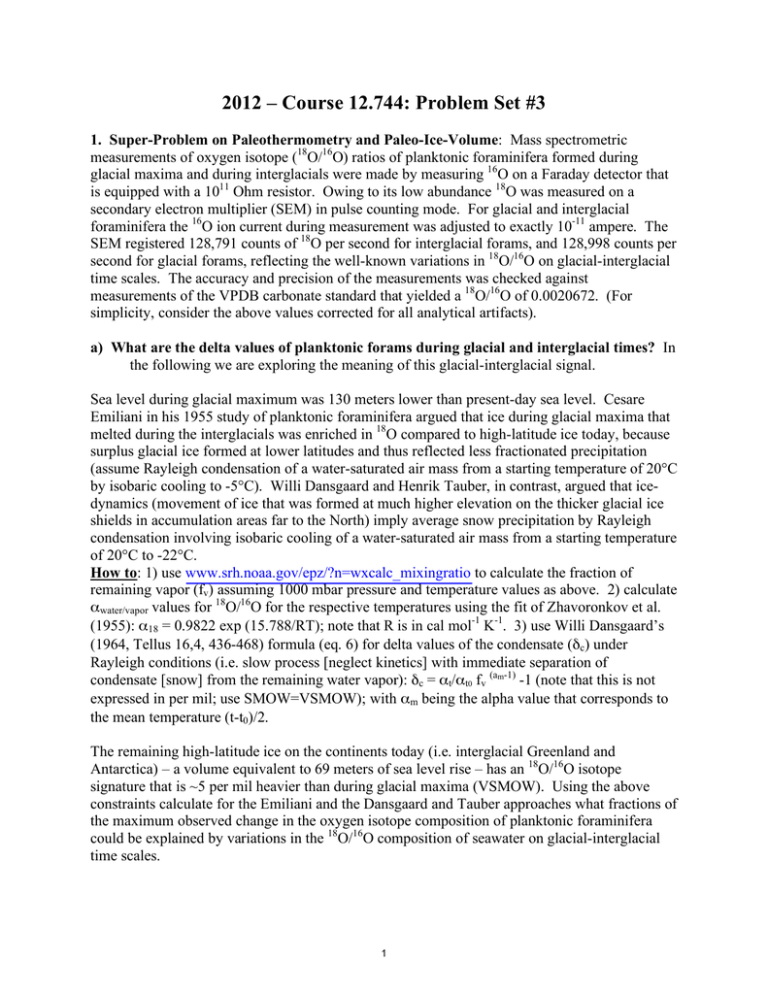
2012 – Course 12.744: Problem Set #3 1. Super-Problem on Paleothermometry and Paleo-Ice-Volume: Mass spectrometric measurements of oxygen isotope (18O/16O) ratios of planktonic foraminifera formed during glacial maxima and during interglacials were made by measuring 16O on a Faraday detector that is equipped with a 1011 Ohm resistor. Owing to its low abundance 18O was measured on a secondary electron multiplier (SEM) in pulse counting mode. For glacial and interglacial foraminifera the 16O ion current during measurement was adjusted to exactly 10-11 ampere. The SEM registered 128,791 counts of 18O per second for interglacial forams, and 128,998 counts per second for glacial forams, reflecting the well-known variations in 18O/16O on glacial-interglacial time scales. The accuracy and precision of the measurements was checked against measurements of the VPDB carbonate standard that yielded a 18O/16O of 0.0020672. (For simplicity, consider the above values corrected for all analytical artifacts). a) What are the delta values of planktonic forams during glacial and interglacial times? In the following we are exploring the meaning of this glacial-interglacial signal. Sea level during glacial maximum was 130 meters lower than present-day sea level. Cesare Emiliani in his 1955 study of planktonic foraminifera argued that ice during glacial maxima that melted during the interglacials was enriched in 18O compared to high-latitude ice today, because surplus glacial ice formed at lower latitudes and thus reflected less fractionated precipitation (assume Rayleigh condensation of a water-saturated air mass from a starting temperature of 20°C by isobaric cooling to -5°C). Willi Dansgaard and Henrik Tauber, in contrast, argued that icedynamics (movement of ice that was formed at much higher elevation on the thicker glacial ice shields in accumulation areas far to the North) imply average snow precipitation by Rayleigh condensation involving isobaric cooling of a water-saturated air mass from a starting temperature of 20°C to -22°C. How to: 1) use www.srh.noaa.gov/epz/?n=wxcalc_mixingratio to calculate the fraction of remaining vapor (fv) assuming 1000 mbar pressure and temperature values as above. 2) calculate αwater/vapor values for 18O/16O for the respective temperatures using the fit of Zhavoronkov et al. (1955): α18 = 0.9822 exp (15.788/RT); note that R is in cal mol-1 K-1. 3) use Willi Dansgaard’s (1964, Tellus 16,4, 436-468) formula (eq. 6) for delta values of the condensate (δc) under Rayleigh conditions (i.e. slow process [neglect kinetics] with immediate separation of condensate [snow] from the remaining water vapor): δc = αt/αt0 fv (am-1) -1 (note that this is not expressed in per mil; use SMOW=VSMOW); with αm being the alpha value that corresponds to the mean temperature (t-t0)/2. The remaining high-latitude ice on the continents today (i.e. interglacial Greenland and Antarctica) – a volume equivalent to 69 meters of sea level rise – has an 18O/16O isotope signature that is ~5 per mil heavier than during glacial maxima (VSMOW). Using the above constraints calculate for the Emiliani and the Dansgaard and Tauber approaches what fractions of the maximum observed change in the oxygen isotope composition of planktonic foraminifera could be explained by variations in the 18O/16O composition of seawater on glacial-interglacial time scales. 1 b) Setting up a mass balance based on the above ice volume and isotope data, determine by how much the oxygen isotope composition of seawater changed between glacial and interglacial (=VSMOW) times. What fraction of the total isotope signal observed in forams can be explained by ice-volume and ice-composition changes? c) Calculate the change in seawater temperature from the residual (corrected for ice volume and composition changes) isotope signal of seawater for the Emiliani and the Dansgaard and Tauber scenarios. Use the Erez and Luz (1983, GCA 47) relationship between the delta value, temperature and the isotopic composition of seawater during carbonate precipitation. 2. The famous geochemist Dansha Ragg wants to determine δ 18O for a sample of CaCO3. The desired 1σ precision is 0.01‰. His shiny new mass spectrometer, which he bought at a flea market in Cambridge, delivers 1 CO2+ to the collector for every 900 molecules of CO2 admitted to the ion source. Assuming that the signal-to-noise ratio of his system is limited only by ion counting statistics, that the measurement is symmetrical (equal integrated ion currents from both the sample and the reference), and that the inlet system is capable of transferring 50% of the sample to the ion source, how many micromoles of CaCO3 will Dansha need? 3. A hard working graduate student was given a sample that was thought to be CO2 for isotopic analysis. When his mass spectrometer dutifully coughed up values for δPDB13C and δSMOW 18O, he realized that the results were entirely fictional. “This”, he said, “might actually be a laughing matter”, and went on to point out that the vapor-pressure vs. T curve for N2O is similar to that of CO2 and that the molecular weights of these gases are identical. The sample didn’t even contain C, but there were ion currents at masses 44, 45, and 46, so there were no problems with the calculation. When this occurred, what values of δPDB13C and δSMOW18O did he get? Assume that the N2O happened to have δAIR15N = 0‰ and δSMOW18O = 0‰. 4. Given that the δD value of H2 gas in this system is –60 ‰ vs. VSMOW and the information in the following table, calculate the equilibrium δD of water vapor in equilibrium with hydrogen gas at 25°C. DGof (kJ/mol) 0.0 -0.350 -54.634 -55.719 Phase H2 (g) HD (g) H2O (g) HDO (g) Does your result depend on the direction you write the equilibrium reaction? In which chemical species is deuterium most stably bonded? 2 MIT OpenCourseWare http://ocw.mit.edu 12.744 Marine Isotope Chemistry Fall 2012 For information about citing these materials or our Terms of Use, visit: http://ocw.mit.edu/terms.
