Phases in antiferroelectric-side Rb D AsO mixed crystals by light scattering
advertisement
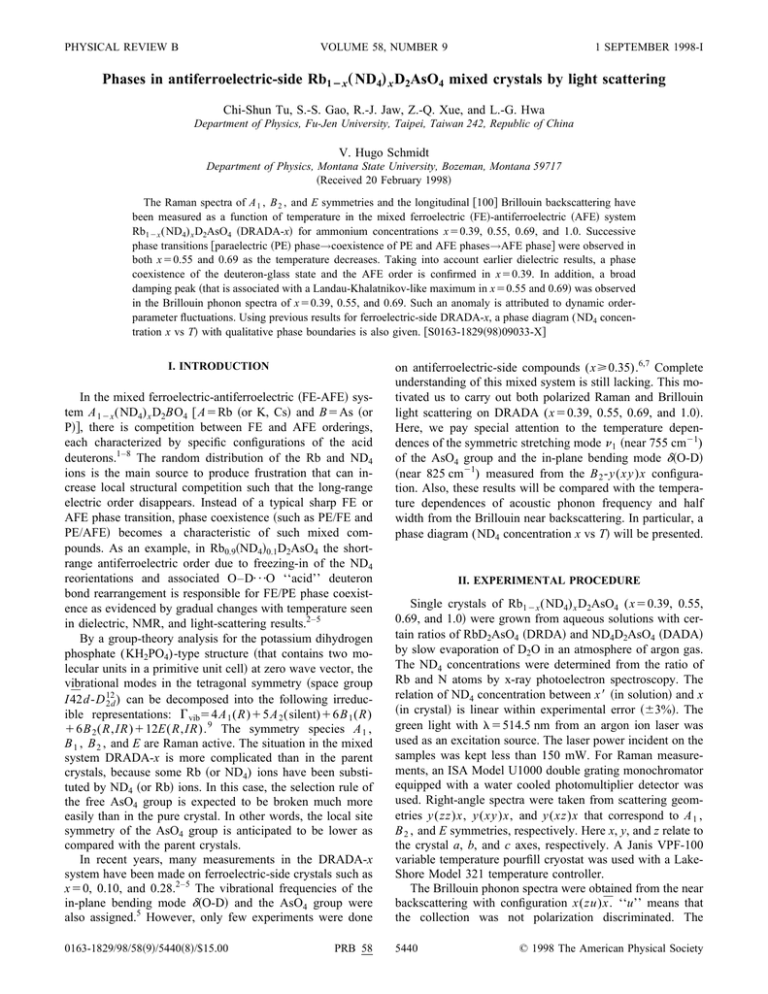
PHYSICAL REVIEW B VOLUME 58, NUMBER 9 1 SEPTEMBER 1998-I Phases in antiferroelectric-side Rb12x „ND4… x D2AsO4 mixed crystals by light scattering Chi-Shun Tu, S.-S. Gao, R.-J. Jaw, Z.-Q. Xue, and L.-G. Hwa Department of Physics, Fu-Jen University, Taipei, Taiwan 242, Republic of China V. Hugo Schmidt Department of Physics, Montana State University, Bozeman, Montana 59717 ~Received 20 February 1998! The Raman spectra of A 1 , B 2 , and E symmetries and the longitudinal @100# Brillouin backscattering have been measured as a function of temperature in the mixed ferroelectric ~FE!-antiferroelectric ~AFE! system Rb12x (ND4) x D2AsO4 ~DRADA-x! for ammonium concentrations x50.39, 0.55, 0.69, and 1.0. Successive phase transitions @paraelectric ~PE! phase→coexistence of PE and AFE phases→AFE phase# were observed in both x50.55 and 0.69 as the temperature decreases. Taking into account earlier dielectric results, a phase coexistence of the deuteron-glass state and the AFE order is confirmed in x50.39. In addition, a broad damping peak ~that is associated with a Landau-Khalatnikov-like maximum in x50.55 and 0.69! was observed in the Brillouin phonon spectra of x50.39, 0.55, and 0.69. Such an anomaly is attributed to dynamic orderparameter fluctuations. Using previous results for ferroelectric-side DRADA-x, a phase diagram (ND4 concentration x vs T! with qualitative phase boundaries is also given. @S0163-1829~98!09033-X# I. INTRODUCTION In the mixed ferroelectric-antiferroelectric ~FE-AFE! system A 12x (ND4) x D2BO4 @ A5Rb ~or K, Cs! and B5As ~or P!#, there is competition between FE and AFE orderings, each characterized by specific configurations of the acid deuterons.1–8 The random distribution of the Rb and ND4 ions is the main source to produce frustration that can increase local structural competition such that the long-range electric order disappears. Instead of a typical sharp FE or AFE phase transition, phase coexistence ~such as PE/FE and PE/AFE! becomes a characteristic of such mixed compounds. As an example, in Rb0.9~ND4!0.1D2AsO4 the shortrange antiferroelectric order due to freezing-in of the ND4 reorientations and associated O–D¯O ‘‘acid’’ deuteron bond rearrangement is responsible for FE/PE phase coexistence as evidenced by gradual changes with temperature seen in dielectric, NMR, and light-scattering results.2–5 By a group-theory analysis for the potassium dihydrogen phosphate (KH2PO4)-type structure ~that contains two molecular units in a primitive unit cell! at zero wave vector, the vibrational modes in the tetragonal symmetry ~space group I4̄2d-D 12 2d ) can be decomposed into the following irreducible representations: G vib54A 1 (R)15A 2 (silent)16B 1 (R) 16B 2 (R,IR)112E(R,IR). 9 The symmetry species A 1 , B 1 , B 2 , and E are Raman active. The situation in the mixed system DRADA-x is more complicated than in the parent crystals, because some Rb ~or ND4) ions have been substituted by ND4 ~or Rb! ions. In this case, the selection rule of the free AsO4 group is expected to be broken much more easily than in the pure crystal. In other words, the local site symmetry of the AsO4 group is anticipated to be lower as compared with the parent crystals. In recent years, many measurements in the DRADA-x system have been made on ferroelectric-side crystals such as x50, 0.10, and 0.28.2–5 The vibrational frequencies of the in-plane bending mode d~O-D! and the AsO4 group were also assigned.5 However, only few experiments were done 0163-1829/98/58~9!/5440~8!/$15.00 PRB 58 on antiferroelectric-side compounds (x>0.35).6,7 Complete understanding of this mixed system is still lacking. This motivated us to carry out both polarized Raman and Brillouin light scattering on DRADA (x50.39, 0.55, 0.69, and 1.0!. Here, we pay special attention to the temperature dependences of the symmetric stretching mode n 1 ~near 755 cm21) of the AsO4 group and the in-plane bending mode d~O-D! ~near 825 cm21) measured from the B 2 -y(xy)x configuration. Also, these results will be compared with the temperature dependences of acoustic phonon frequency and half width from the Brillouin near backscattering. In particular, a phase diagram (ND4 concentration x vs T! will be presented. II. EXPERIMENTAL PROCEDURE Single crystals of Rb12x (ND4) x D2AsO4 (x50.39, 0.55, 0.69, and 1.0! were grown from aqueous solutions with certain ratios of RbD2AsO4 ~DRDA! and ND4D2AsO4 ~DADA! by slow evaporation of D2O in an atmosphere of argon gas. The ND4 concentrations were determined from the ratio of Rb and N atoms by x-ray photoelectron spectroscopy. The relation of ND4 concentration between x 8 ~in solution! and x ~in crystal! is linear within experimental error ~63%!. The green light with l5514.5 nm from an argon ion laser was used as an excitation source. The laser power incident on the samples was kept less than 150 mW. For Raman measurements, an ISA Model U1000 double grating monochromator equipped with a water cooled photomultiplier detector was used. Right-angle spectra were taken from scattering geometries y(zz)x, y(xy)x, and y(xz)x that correspond to A 1 , B 2 , and E symmetries, respectively. Here x, y, and z relate to the crystal a, b, and c axes, respectively. A Janis VPF-100 variable temperature pourfill cryostat was used with a LakeShore Model 321 temperature controller. The Brillouin phonon spectra were obtained from the near backscattering with configuration x(zu)x̄. ‘‘u’’ means that the collection was not polarization discriminated. The 5440 © 1998 The American Physical Society PRB 58 PHASES IN ANTIFERROELECTRIC-SIDE . . . 5441 FIG. 1. Temperature-dependent Raman spectra (50– 103 cm21) of DRADA ~a! x50.69, ~b! x50.55, and ~c! x50.39 measured from the B 2 -y(xy)x geometry. samples were illuminated along @100#, so the longitudinal acoustic ~LA! phonons with wave vector along @100# were studied. According to the theoretical calculation for a tetragonal structure, there should be no transverse acoustic ~TA! mode to be expected in the case of backscattering due to a weak intensity factor.10 Scattered light was analyzed by a Burleigh five-pass Fabry-Perot interferometer. To improve the spectral resolution, the Brillouin doublet was adjusted to appear in the second order with respect to the Rayleigh line. In our experiments, the free spectral range ~FSR! of the Fabry-Perot is determined by measuring the LA phonon shift of fused quartz. The free spectral range was 20.63 GHz for the spectra of this paper. A Janis CCS-150 closed cycle refrigerator was used with a LakeShore Model 340 temperature controller. To determine the accurate positions and half widths of both the Raman and Brillouin components, the damped harmonic oscillator model with the spectral response function11 S~ v !5 x 0 G vv 20 ~v 2 2 v 20 ! 2 1G 2 v 2 1 12e 2\ v /kT , ~1! was used, where v 0 and G obs correspond to the phonon frequency and observed half width, respectively, x 0 is the susceptibility constant ~in arbitrary units!, k is Boltzmann’s constant, and T is the absolute temperature. For Brillouin backscattering, the broadening due to collection optics is negligible.12 In this case, the natural-phonon half width G ph is given by G ph5G obs2G inst .3 In our experiments, the half 5442 TU, GAO, JAW, XUE, HWA, AND SCHMIDT PRB 58 FIG. 2. Frequency vs temperature variations of two Raman vibrations ~measured from the B 2 symmetry! of DRADA ~a! x50.69, ~b! x50.55, and ~c! x50.39. These two modes correspond to the in-plane bending mode d (O-D) ~open circle! and the stretching mode n 1 ~solid circle! of the AsO4 group. The dashed lines are guides for the eye and the dotted lines are the estimates of various phase boundaries. width of the laser line ~for l5514.5 nm) is about 0.02 GHz, determined by the spectrometer. The half width of the Rayleigh line from fused quartz ~that was assumed to have a Gaussian profile! was taken as the instrumental broadening G inst;0.007 FSR. III. RESULTS AND DISCUSSION Actual temperature-dependent B 2 -y(xy)x Raman spectra are shown in Figs. 1~a!–1~c! for x50.69, 0.55, and 0.39, respectively. All three compounds display a similar Raman pattern and high scattering efficiency in the high-frequency region (720– 850 cm21). However, at low frequency (,500 cm21), x50.39 shows different vibrational components as compared to x50.69 and 0.55. Specifically, the Raman spectra of x50.39 do not show any apparent difference as temperature changes. The main Raman lines observed from the B 2 configuration are at frequencies near 290, 320, 400, 760, and 820 cm21. The temperature dependences of the in-plane bending mode d~O-D! ~near 825 cm21) and the stretching mode n 1 ~near 760 cm21) of the AsO4 group from the B 2 symmetry for x50.69, 0.55, and 0.39, are plotted in Figs. 2~a!–2~c!, respectively. As temperature decreases, the d~O-D! modes of both x50.69 and 0.55 show a notable hardening ~that is more progressive in x50.55). On the contrary, the stretching modes n 1 ~near 760 cm21) display a gradual softening that begins at T;230 and ;180 K and ends at T;160 and ;110 K in x50.69 and 0.55, respectively. Instead of a slow rising, abrupt step-up and step-down behavior ~at ;100 K! were observed in the d~O-D! and n 1 modes in x50.39, respectively. Figures 3~a!–3~c! show the actual LA@100# phonon spectra of the anti-Stokes Brillouin component for x50.69, 0.55, and 0.39, respectively. The data shown here are for several temperatures near the maximum value of half width. The solid lines are fits of Eq. ~1!, from which the frequency shift and half width G obs were obtained. Figures 4~a!–4~c! display PRB 58 PHASES IN ANTIFERROELECTRIC-SIDE . . . 5443 FIG. 3. Anti-Stokes components of the LA@100# Brillouin phonon spectra for temperatures around the maximum value of half width for ~a! x50.69, ~b! x50.55, and ~c! x50.39. The open circles are the measured data and solid lines are fits of Eq. ~1!. the temperature dependences of the frequency shift and half width G ph . The phonon frequency increases as ammonium concentration increases due to the lighter molecular mass of ND4 ion. With increasing temperature, the phonon frequencies of all compounds exhibit a softening ~that shows an almost linear curve in x50.39). The damping data of Figs. 4~a!–4~c! exhibit a gradual growth and reach a broad maximum near 230, 180, and 140 K for x50.69, 0.55, and 0.39, respectively. Such a development of damping must be associated with the order-parameter fluctuations that are characteristic of an h 2 m -type coupling, squared in order parameter and linear in strain.13 An additional sharp peak ~that can be connected with the Landau-Khalatnikov maximum! was also observed near 190 and 140 K in x50.69 and 0.55, respectively. The Landau-Khalatnikov maximum usually occurs near T c and can be used as an indication of a long-range order FE or AFE phase transition.3,13,14 To determine the relation between phase characteristic and ammonium concentration, the low-temperature spectra from scattering geometries A 1 -y(zz)x and E-y(xz)x were measured for x51.0, 0.69, 0.55, and 0.39, and are given in Figs. 5~a!–5~b!, respectively. Figure 5~c! shows a comparison of the B 2 spectra. The main vibrations of the A 1 , B 2 , and E symmetries are summarized in Table I. The stretching mode n 1 ~near 750 cm21) of the AsO4 group is nondegenerate with only A 1 symmetry.15 However, as shown in Figs. 5~a!–5~c! and Table I, the leakage of the n 1 mode into the E and B 2 symmetries is practically as strong as the permitted vibrations. The n 1 leakage that occurs in both the E and B 2 configurations is possible as the result of the lowering of local symmetry of the AsO4 groups from S 4 to C 2 or even to C 1 . Another interesting feature ~as seen in Table I! is that a frequency doublet with a narrow splitting of about 10 cm21 was observed in the n 1 modes of the A 1 , B 2 , and E geometries for all samples. A possible reason for this splitting is that different AsO4 groups have different combinations of surrounding ions, which will cause slight perturbation to the n 1 frequency. A similar symmetry leakage was also observed in the doubly degenerate bending modes n 2 ~near 290 and 325 cm21) of the AsO4 group, which should be observed in the A 1 and B 2 modes if the AsO4 group has S 4 site symmetry. 5444 TU, GAO, JAW, XUE, HWA, AND SCHMIDT PRB 58 FIG. 4. Brillouin shift ~open circle! and half width G ph ~solid circle! vs temperature of the LA@100# phonons for ~a! x50.69, ~b! x 50.55, and ~c! x50.39. The dashed lines are guides to the eye and the dotted lines are the estimates of various phase boundaries. What are the origins of these temperature-dependent phenomena shown in Figs. 2~a! and 4~a! for x50.69? With decreasing temperature, the stretching mode n 1 ~near 755 cm21) of x50.69 begins a gradual softening near 230 K and then reaches a minimum at ;160 K. The n 1 mode is sensitive to the deuteron ordering near the AsO4 group. In other words, if the deuteron arrangement modulates with temperature, the mass and force constants of the D2AsO4 group will be changed and thus influence the n 1 frequency. As shown in Figs. 5~a!–5~c!, x50.69 has a Raman pattern similar to pure DADA in the low-temperature region. In addition, the half width of the d~O-D! mode ~near 824 cm21) becomes much broader as T.;160 K @see Fig. 1~a!#. The n 2 mode ~near 325 cm21), which is the strongest component in the low-frequency region (,500 cm21) of DADA, also shows up apparently at T;160 K. The acoustic damping @shown in Fig. 4~a!# also has an abrupt drop and reaches a minimum near 160 K. Thus, one can conclude that x50.69 possesses an AFE ordering below T;160 K. What does the progressive softening ~that begins at ;230 K and ends at ;160 K! of the n 1 mode mean? Comparison can be made to earlier Brillouin scattering results from the ferroelectric-side DRADA-x system,3 in which a similar acoustic damping anomaly ~a broad maximum associated with a sharp peak! PRB 58 PHASES IN ANTIFERROELECTRIC-SIDE . . . 5445 FIG. 5. Raman spectra of the ~a! A 1 -y(zz)x, ~b! E-y(xz)x, and ~c! B 2 -y(xy)x symmetries measured at 80 K ~for x50.69, 0.55, and 0.39! and 100 K ~for DADA!. was observed in DRADA-0.10.3 It was connected to a PE/FE phase coexistence due to the freezing-in of ND4 reorientations associated with local destruction of FE ordering DRADA-0.10. For DRADA-0.69, one can expect that the partial replacement of ND4 molecular groups by Rb atoms can cause growth of local structural competition ~between FE and AFE orderings!, so that long-range AFE ordering could be suppressed. In other words, neither a pure AFE nor PE phase but rather a PE/AFE phase coexistence will develop with decreasing temperature. As in DRADA-0.10, the broad damping maximum, centered at T m ;230 K in DRADA-0.69, can be linked to the onset of phase coexistence of the PE/AFE type in this case. Moreover, the acoustic-phonon frequency @Fig. 4~a!# also exhibits successive slope changes at ;230 and ;160 K as the temperature decreases. In addition, the Landau-Khalatnikov maximum centered at ;190 K ~that also corresponds to an abrupt drop in the n 1 mode! is an evidence of a rapid growth of the AFE ordering. On the whole, one can conclude that PE/AFE phase coexistence begins at T m ;230 K and then the crystal has a rapid growth of AFE ordering at ;190 K. Below T ;160 K, the AFE ordering becomes completely dominant in the x50.69 crystal. As shown in Fig. 2~b!, an even smoother softening in the n 1 mode was observed for x50.55. This gradual declining behavior begins at T;180 K and reaches a turning point at T;110 K. The d~O-D! mode also exhibits a gradual hardening that initiates at T;180 K and ends at T;110 K. As seen in Figs 5~a!–5~c!, all the A 1 , B 2 , and E symmetries of x 50.55 have a similar Raman spectra like those of pure DADA in the low-temperature region. In addition, the n 2 mode ~near 325 cm21), which is the main vibration in the low-frequency region (,500 cm21) of pure DADA, also grows dramatically near 130 K @see Fig. 1~b!#. The acoustic 5446 PRB 58 TU, GAO, JAW, XUE, HWA, AND SCHMIDT TABLE I. Frequencies of observed Raman modes ~in cm21) in DRADA (x51.0, 0.69, 0.55, and 0.39!. The spectra were obtained at T580 K ~for x50.69, 0.55, 0.39! and 100 K ~for DADA!. 1.0 832 829 762 752 689 660 423 402 374 353 328 295 285 207 203 160 142 B 2 -y(xy)x 0.69 0.55 0.39 826 771 754 686 825 762 753 823 771 756 687 429 404 368 352 323 291 432 404 361 404 370 324 294 287 209 162 207 165 324 298 285 1.0 832 813 765 752 690 659 425 403 374 353 329 296 287 208 192 172 161 146 E-y(xz)x 0.69 0.55 827 765 754 826 768 754 0.39 826 768 755 698 1.0 832 814 764 752 691 659 427 403 375 353 329 290 A 1 -y(zz)x 0.69 0.55 0.39 828 758 751 826 768 754 678 825 768 756 410 327 290 429 405 368 350 323 289 325 290 676 427 404 368 352 323 290 208 208 207 207 207 163 164 162 163 165 426 404 369 damping also has an abrupt drop and reaches a minimum near 110 K @see Fig. 4~b!#. Thus, one can conclude that the x50.55 crystal has complete AFE ordering below T ;110 K. What are the origins of the progressive softening and hardening ~that begins at ;180 K and ends at ;110 K! in the n 1 mode and the d~O-D! mode, respectively? An acoustic damping anomaly similar to that for x50.69 was also observed in DRADA-0.55. Such a broad damping maximum centered at T m ;180 K can be connect to the onset of formation of PE/AFE phase coexistence as for x50.69. An additional Landau-Khalatnikov maximum centered at ;140 K was also observed and reveals a rapid growth of the AFE ordering near 140 K. Besides, the temperature dependency of the acoustic-phonon frequency also exhibits successive anomalies ~two slight plunges! at ;180 and ;110 K with decreasing temperature @see Fig. 4~b!#. Thus, it is reasonable to conclude that x50.55 exhibits PE/AFE phase coexistence which begins to form at T m ;180 K, and then has rapid growth of the AFE ordering at ;140 K. Below T;110 K, the AFE ordering becomes completely dominant in x 50.55. For x50.39, instead of a smooth rising, a step-up hardening and step-down softening were observed at T;100 K in the in-plane bending mode d~O-D! ~near 821 cm21) and the stretching mode n 1 ~near 758 cm21), respectively @see Fig. 2~c!#. As shown in Figs. 5~b! and 5~c!, x50.39 has similar Raman spectra with x51.0, 0.69, and 0.55 in both the E and B 2 configurations in the low-temperature region. However, the A 1 symmetry of x50.39 shows an apparent different spectrum compared with the A 1 spectra of x50.55, 0.69, and 1.0 in the low-frequency region (,500 cm21). As seen in Fig. 5~a!, only two clear vibrations ~;290 and ;210 cm21) of the AsO4 group are left in the low-frequency region. It implies that the long-range-order antiferroelectric phase somehow has been modified in the low-temperature region in 429 407 368 353 322 290 370 368 325 289 279 208 x50.39. Another important feature in x50.39 is that its B 2 Raman spectra do not show any obvious change from 80 K up to room temperature @see Fig. 1~c!#. Also, the temperature dependency of the acoustic-phonon frequency @Fig. 4~c!# does not show any apparent anomaly. These phenomena indicate that the crystal structure is essentially the same in the temperature region (300>T>80 K). Furthermore, the acoustic damping shows a gradual growth ~without the Landau-Khalatnikov maximum! and has a rough maximum near 140 K. Such an acoustic damping anomaly is similar to DRADA-x50.28 and suggests the existence of a glass state ~short-range order in cluster!. The earlier dielectric results (« 8 and « 9 ) of x50.39 obtained by Trybula, Stankowski, and Los showed a frequency dispersion below ;100 K.6 Two different relaxation mechanisms which were found by fitting the experimental data with two gaussian-shape curves, were attributed to a phase coexistence of deuteron-glass FIG. 6. Phase diagram (ND4 concentration vs T! for the DRADA-x system. The dashed lines are estimates of various phase boundaries. The solid circles are the measured data from this present work and open circles are from Refs. 2–7 and 16. PHASES IN ANTIFERROELECTRIC-SIDE . . . PRB 58 ~DG! state and antiferroelectric order. Thus, one can expect that the differences between the A 1 and B 2 ~or E! spectra (,500 cm21) in x50.39 can be related to two distinct local structural orderings. We conclude that the two breaks ~at T ;100 K) in both the d~O-D! and n 1 modes @see Fig. 2~c!# indicate the onset of DG/AFE phase coexistence. With the previous NMR, dielectric, and Brillouin scattering results of DRADA (x50, 0.10, 0.28, 0.39, and 1.0!,2–7,16 a phase diagram ~ammonium concentration x vs temperature! is plotted in Fig. 6. The dashed lines are qualitative estimates of various phase boundaries. Such an asymmetric phase diagram verifies that the ND4 ion has a stronger ordering effect than the Rb ion in the DRADA-x system. 5447 ing temperature, successive phase transitions ~PE ordering→PE/AFE phase coexistence→AFE ordering! are confirmed in both x50.55 and 0.69. Instead of a PE/AFE coexistence, x50.39 shows a DG/AFE phase coexistence taking place at T;100 K; ~ii! the Raman spectra of the A 1 , B 2 , and E species exhibit a strong symmetry leakage possibly due to the lowering of local site symmetry of the AsO4 group, and ~iii! the phase diagram of DRADA-x is much more asymmetric as compared to that of RB12x (NH4 ) x H2PO4 ~RADP!.8 Based on the present results, we propose that the DG state should exist for the ammonium concentration range of 0.2<x,0.39. ACKNOWLEDGMENTS IV. CONCLUSIONS From the temperature-dependent Raman and Brillouin spectra of DRADA-1.0, 0.69, 0.55, and 0.39, three important features have been revealed in this report: ~i! With decreas- 1 V. H. Schmidt, S. Waplak, S. Hutton, and P. Schnackenbeg, Phys. Rev. B 30, 2795 ~1984!. 2 N. J. Pinto, F. L. Howell, and V. H. Schmidt, Phys. Rev. B 48, 5983 ~1993!. 3 C.-S. Tu, and V. H. Schmidt, Phys. Rev. B 50, 16 167 ~1994!. 4 N. J. Pinto, Ph.D. thesis, Montana State University, 1993. 5 C.-S. Tu, R.-M. Chien, and V. H. Schmidt, Phys. Rev. B 55, 2920 ~1997!. 6 Z. Trybula, J. Stankowski, and S. Los, Physica B 191, 312 ~1993!. 7 Z. Trybula, S. Waplak, J. Stankowski, S. Los, V. H. Schmidt, and J. E. Drumheller, Ferroelectrics 156, 371 ~1994!. 8 E. Courtens, Ferroelectrics 72, 229 ~1987!. The authors would like to express sincere thanks to Dan Brandt for crystal growth. This work was supported by NSC Grant Nos. NSC86-2112-M-030-002 and NSC87-2112-M030-001, and NSF Grant No. DMR-9520251. M. S. Shur, Kristallografiya 11, 448 ~1966! @Sov. Phys. Crystallogr. 11, 394 ~1966!#. 10 R. Vacher and L. Boyer, Phys. Rev. B 6, 639 ~1972!. 11 J. F. Ryan, R. S. Katiyar, and W. Taylor, Effet Raman et Théorie C2, 49 ~1971!. 12 H. G. Danielmeyer, J. Acoust. Soc. Am. 47, 151 ~1970!. 13 W. Rehwald, Adv. Phys. 22, 721 ~1973!. 14 T. Hikita, P. Schnackenberg, and V. H. Schmidt, Phys. Rev. B 31, 299 ~1985!. 15 G. Herzberg, Infrared and Raman Spectra of Polyatomic Molecules ~Van Nostrand, Princeton, NJ, 1945!. 16 C. Kittel, Introduction to Solid State Physics, 6th ed. ~Wiley, New York, 1976!, p. 386. 9
