Math 170: Elementary Statistics, Tuesday 11-12:15pm, Winter 2016
advertisement
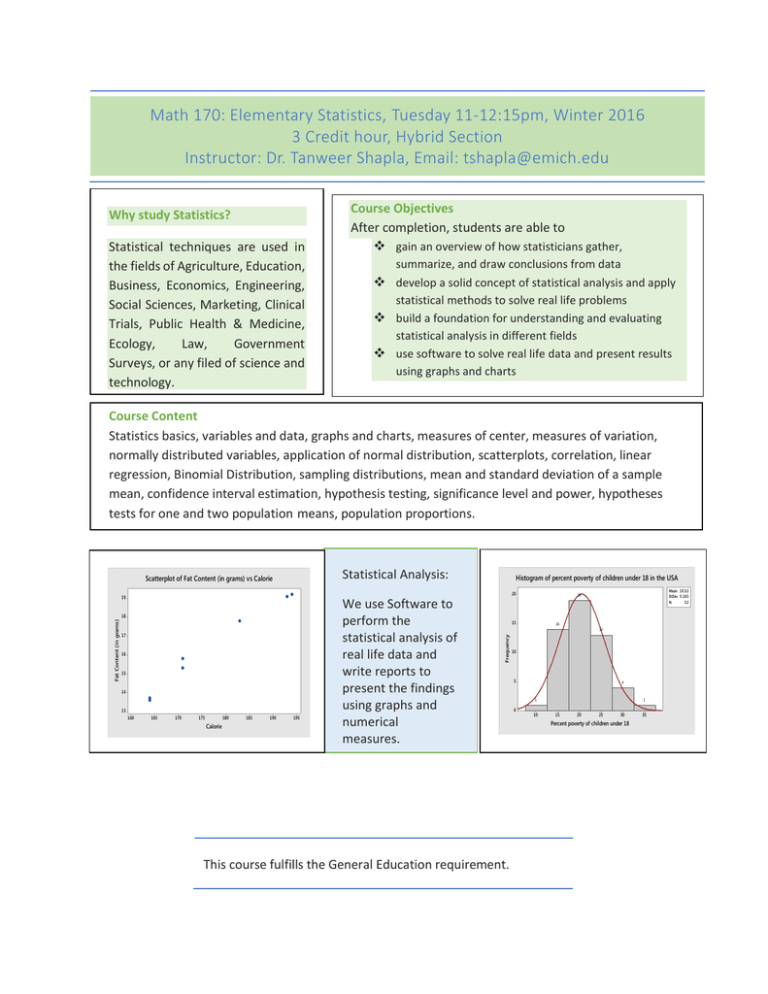
Math 170: Elementary Statistics, Tuesday 11-12:15pm, Winter 2016 3 Credit hour, Hybrid Section Instructor: Dr. Tanweer Shapla, Email: tshapla@emich.edu Why study Statistics? Statistical techniques are used in the fields of Agriculture, Education, Business, Economics, Engineering, Social Sciences, Marketing, Clinical Trials, Public Health & Medicine, Ecology, Law, Government Surveys, or any filed of science and technology. Course Objectives After completion, students are able to gain an overview of how statisticians gather, summarize, and draw conclusions from data develop a solid concept of statistical analysis and apply statistical methods to solve real life problems build a foundation for understanding and evaluating statistical analysis in different fields use software to solve real life data and present results using graphs and charts Course Content Statistics basics, variables and data, graphs and charts, measures of center, measures of variation, normally distributed variables, application of normal distribution, scatterplots, correlation, linear regression, Binomial Distribution, sampling distributions, mean and standard deviation of a sample mean, confidence interval estimation, hypothesis testing, significance level and power, hypotheses tests for one and two population means, population proportions. Statistical Analysis: Scatterplot of Fat Content (in grams) vs Calorie 18 17 16 15 14 13 160 165 170 175 180 Calorie 185 190 195 We use Software to perform the statistical analysis of real life data and write reports to present the findings using graphs and numerical measures. Mean 20.52 StDev 5.165 N 52 19 15 14 13 Frequency 19 Fat Content (in grams) Histogram of percent poverty of children under 18 in the USA 20 This course fulfills the General Education requirement. 10 5 4 1 0 10 1 15 20 25 30 Percent poverty of children under 18 35
