26. Let n be the mean number of electrons... Show that the mean of the square of the...
advertisement
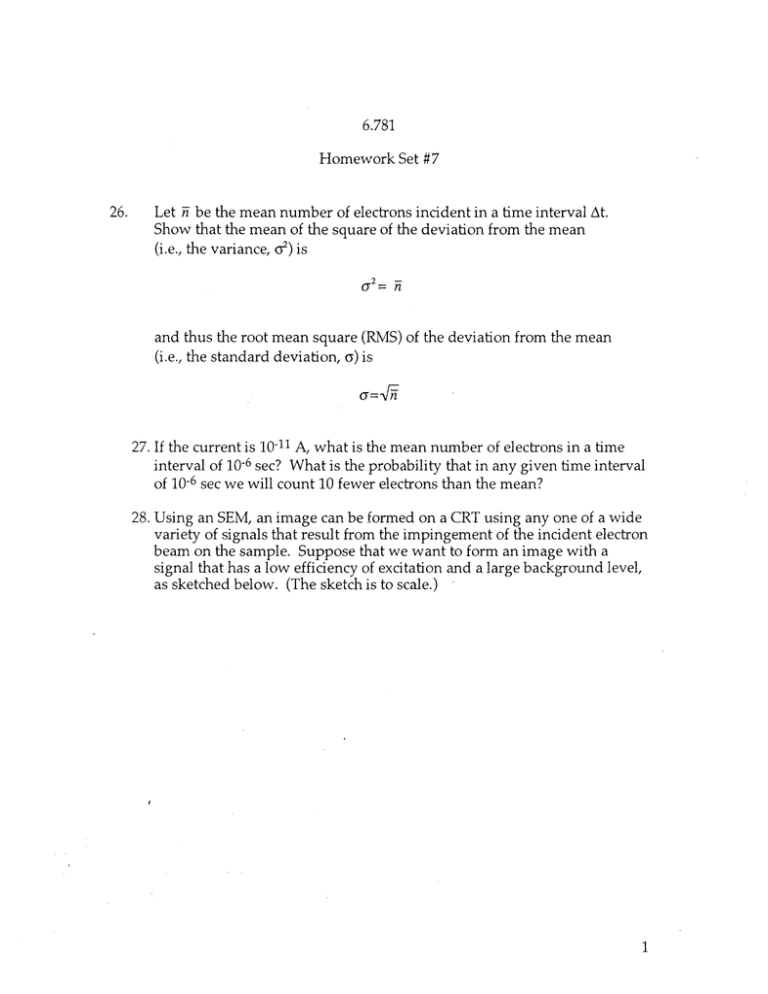
6.781 Homework Set #7 26. Let n be the mean number of electrons incident in a time interval At. Show that the mean of the square of the deviation from the mean (i.e., the variance, 02) is 2 and thus the root mean square (RMS)of the deviation from the mean (i.e., the standard deviation, Y)is c=4 27. If the current is 10-11A, what is the mean number of electrons in a time interval of 10-6sec? What is the probability that in any given time interval of 10-6sec we will count 10 fewer electrons than the mean? 28. Using an SEM, an image can be formed on a CRT using any one of a wide variety of signals that result from the impingement of the incident electron beam on the sample. Suppose that we want to form an image with a signal that has a low efficiency of excitation and a large background level, as sketched below. (The sketch is to scale.) 1 white level set here io signal emerges ! nsw nsB t or x Note that at one point on the sample a hole is drilled so that we can determine the true background level. That is, no signal can emerge from the hole. The level nswcorresponds to a current at the noise bottleneck that is only 2% of the input beam current. The SEMis a field emission type with the following specifications: Cs = 10 mm Cc -=10 mm E = 30 keV AE = 0.5 eV sample-to-collector distance =10 mm B - 5x 10⁷ A/cm 2 Sr We want a CRT display with 5 grays levels, 500 lines, and a probability of error in any pixel not exceeding 1%. The maximum tolerable frame time is 100 sec. a) What spatial resolution is achievable? b) Can you suggest some modifications that would improve the spatial resolution? 2 29. Read the attached article, [Yamada, S., T. Ito, K. Gouhara, and Y. Uchikawa, "Electron-Count Imaging in SEM," Scanning 13, 165-171 (1991)]. a. Summarize the basic idea of the paper. In particular, what is the origin of the noise that their method reduces? Give an example of a noise source that their method does not impact. b. In figure 4, bottom row, the caption tells us that there were on average 10.6counts/original pixel. Assuming a Poissonian distribution of counts, if you assign "black" to <5 and "white" to >5, what is your probability of error in assigning a given color (black or white) to a pixel (using their digital counting method)? References Problem 29 Yamada, S., T. Ito, K. Gouhara, and Y. Uchikawa. "Electron-Count Imaging in SEM." Scanning 13, no. 2 (1991): 165-171. 3
