Module 2 overview
advertisement
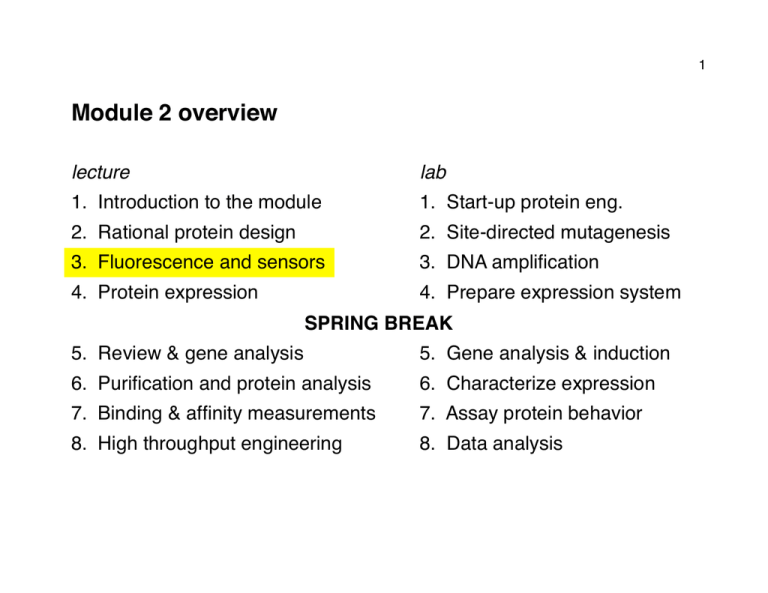
1 Module 2 overview lecture lab 1. Introduction to the module 1. Start-up protein eng. 2. Rational protein design 2. Site-directed mutagenesis 3. Fluorescence and sensors 3. DNA amplification 4. Protein expression 4. Prepare expression system SPRING BREAK 5. Review & gene analysis 5. Gene analysis & induction 6. Purification and protein analysis 6. Characterize expression 7. Binding & affinity measurements 7. Assay protein behavior 8. High throughput engineering 8. Data analysis 2 Lecture 3: Fluorescence and sensors I. Basics of fluorescence A. Important applications B. Energy levels and spectra C. Emission, quenching, and energy transfer II. Fluorescent calcium sensors A. Properties of calcium sensors B. Applying Ca2+ sensors in cells C. In vivo limitations and remedies D. Advantages of genetically-encoded sensors 3 fluorescence/luminescence microscopy H. Lehmann & S. von Prowazek (1913) www.zeiss.com laser scanning microscopy Denk & Svoboda (1997) Neuron Courtesy of Elsevier, Inc., http://www.sciencedirect.com. Used with permission. functional imaging anatomical imaging & histology Nagai et al. (2001) PNAS Livet et al. (2007) Nature Courtesy of National Academy of Sciences, U. S. A. Used with permission. Source: Nagai, T., et al. "Circularly Permuted Green Fluorescent Proteins Reprinted by permission from Macmillan Publishers Nature Ltd. Engineered to Sense Ca2+." PNAS 98, no. 6 (March 6, 2001): 3197-3202. Expression of Fluorescent Proteins in the Nervous System." Nature 450 (2007): 56-62. © 2007. Copyright © 2001 National Academy of Sciences, U.S.A. Source: Livet, J., et al. "Transgenic Strategies for Combinatorial 4 5 www.caliperls.com in vitro assays Courtesy of Caliper Life Sciences, Inc. Used with permission. 6 Introduction to fluorescence Fluorescence arises from transitions among molecular energy levels: Jablonski diagram • electronic energy levels correspond to visible wavelengths, • vibrational energy levels correspond to infrared wavelengths, with • rotational energy levels are coupled to vibrations and account for the smooth appearance of absorption/emission spectra 7 Absorption abs. em. fluorescein Public domain image. 350 400 450 500 550 Wavelength (nm) 600 Fluorescence emission Stokes shift Fluorescence spectra for a typical fluorophore 650 Image by MIT OpenCourseWare. • small organics like fluorescein are the most common fluorophores • in general, the larger the aromatic ring system, the longer the wavelength for excitation and emission • quantum dots are ~10 nm particles that exhibit narrower emission bands and less “bleaching” than organic dyes • some atoms (lanthanides) exhibit fluorescence as well 8 tetramethylrhodamine isothiocyanate em = 580 nm 9 Decay of excited electrons can occur by radiative and nonradiative processes. If N is the fraction of fluorophore in the excited state, and and k are radiative and nonradiative decay rates, respectively: ( ) dN = +k N dt such that N = N0 e ( ) = N e t 0 +k t where is the fluorescence lifetime, incorporating both and k: = 1 +k 0 describes the fluorescence lifetime in the absence of nonradiative decay. The efficiency of a fluorophore is quantified by its quantum yield Q: Q= = + k 0 One of the main routes of nonradiative decay is a process called quenching, which results in environmental sensitivity for many fluorescent molecules, and underlies the mechanism of several sensors Fluorescence resonance energy transfer (FRET) can take place when the absorption spectrum of an “acceptor” overlaps with the emission spectrum of a “donor,” and geometry favors dipolar coupling between the fluorophores. The distance at which 50% of excited donors are deexcited by the FRET mechanism is defined as the Förster radius (usu. 10-100 Å): R0 = 8.8 1012 2 n4 QYD J( ) Courtesy of Life Technologies, Carlsbad, CA. Used with permission. FRET efficiency is defined as: ( ) E = 1+ r R0 6 1 1/ 6 10 11 Fluorescent calcium sensors A wide variety of fluorescent calcium dyes are available. They differ along several axes: • calcium affinity • absorbance and emission properties • structural properties (e.g. protein vs. small molecule, membrane permeability, binding and localization) Indicators with each set of properties may be suitable for specific experiments. 12 A typical calcium sensor consists of a calcium sensitive component attached to one or more fluorescent moieties: BAPTA Fluo-3 EGTA dichlorofluorescein Fluo dyes: • visible absorption/emission wavelengths • virtually no emission in absence of Ca2+ • range of calcium affinities Courtesy of Life Technologies, Carlsbad, CA. Used with permission. Fluo-3 Spectra 13 14 Sensors with different calcium affinities (Kd values) may be appropriate for different applications: spontaneous Ca2+ fluctuations in Xenopus embryo Image removed due to copyright restrictions. See http://www.invitrogen.com/site/us/en/home/support/ Research-Tools/Image-Gallery/Image-Detail.2404.html. calcium transients in dendritic spines Image removed due to copyright restrictions. See http://tools.invitrogen.com/content/sfs/gallery/high/g001633.jpg. www.invitrogen.com 15 Calcium Green & related dyes What is the significance of having a dye with high fluorescence intensity or dynamic range? SNR Courtesy of Life Technologies, Carlsbad, CA. Used with permission. 16 How are calcium dyes applied to cells? single cell injection Image from Svoboda, K., et al. "In vivo Dendritic Calcium Dynamics in Neocortical Pyramidal Neurons." Nature 385, no. 6612 (1997): 161-165. © Macmillan Publishers Ltd: Nature. All rights reserved. This content is excluded from our Creative Commons license. For more information, see http://ocw.mit.edu/fairuse. AM-esters multicellular loading (or bath application) Courtesy of National Academy of Sciences, U. S. A. Used with permission. Source: Stosiek, C., et al. "In vivo Two-Photon Calcium Imaging of Neuronal Networks." PNAS 100, no. 12 (2003): 7319-7324. Copyright © 2003, National Academy of Sciences, U.S.A. Courtesy of Life Technologies, Carlsbad, CA. Used with permission. 17 limitation effect on experiments solution dye binds to intracellular proteins and does not function loss of fluorescence responses, alteration of calcium sensitivity alter localization/ solubility, e.g. using dextran conjugate dye leaks from cell or is sequestered into inappropriate cellular compartments loss of fluorescence responses, higher background fluorescence use dextran conjugates or targeted indicators, ratiometric imaging loss of fluorescence responses lower imaging duty cycle, select dyes with low bleaching, ratiometric imaging dye bleaches over the course of experiments Ratiometric measurements 18 Suppose you measure fluorescence intensity from a cell, but you dont know either how much dye is present or what the calcium concentration is; you have one equation in two unknowns ([L]tot and [Ca2+]): ( Ftot = FCa2+ [L Ca 2+ ] + Ffree [L]tot [L Ca 2+ ] where [L Ca ] = 2+ [L]tot (1+ K d [Ca 2+ ] ) ) The trick is to combine measurements at the first wavelength with measurements at another wavelength, to get a second equation: ( * 2+ 2+ * Ftot* = FCa [L Ca ] + F [L] [L Ca ] 2+ free tot = F * [L]tot ) (if F * is independend t of Ca 2+ ) “isosbestic point” The ratio F/F* is independent of [L]tot and depends only on the calcium concentration. Courtesy of Life Technologies, Carlsbad, CA. Used with permission. 19 limitation effect on experiments solution dye binds to intracellular proteins and does not function loss of fluorescence responses, alteration of calcium sensitivity alter localization/ solubility, e.g. using dextran conjugate dye leaks from cell or is sequestered into inappropriate cellular compartments loss of fluorescence responses, higher background fluorescence use use dextran conjugates or proteins targeted indicators, ratiometric imaging loss of fluorescence responses lower imaging duty use cycle, select dyes proteins with low bleaching, ratiometric imaging dye bleaches over the course of experiments 20 Image from Kotlikoff, M. I. "Genetically Encoded Ca2+ indicators: Using Genetics and Molecular Design to Understand Complex Physiology." J Physiol 578 (2007): 55-67. Copyright © 2003 John Wiley & Sons. Reprinted with permission. Genetically-encoded calcium sensors: • FRET-based CaM-XFP fusions (CaMeleons) • CaM + single XFPs (pericams, camgaroos, GCaMPs) • troponin C based Advantages of genetically-encoded calcium indicators: • noninvasive delivery (expression within cells) • constant resynthesis (limited effect of bleaching) • targeted expression Protein sensors genes can be introduced by making transgenics, or by in vivo transfection (viral, electroporation, “biolistics,” etc.). MIT OpenCourseWare http://ocw.mit.edu 20.109 Laboratory Fundamentals in Biological Engineering Spring 2010 For information about citing these materials or our Terms of Use, visit: http://ocw.mit.edu/terms.
