Moist Convection Above a thin boundary layer, most atmospheric 1
advertisement
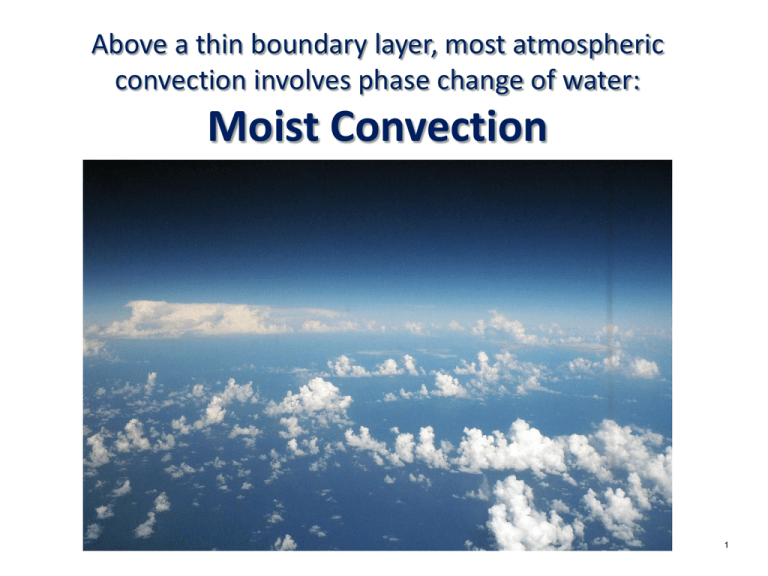
Above a thin boundary layer, most atmospheric convection involves phase change of water: Moist Convection 1 Moist Convection • Significant heating owing to phase changes of water • Redistribution of water vapor – most important greenhouse gas • Significant contributor to stratiform cloudiness – albedo and longwave trapping 2 Phase Equilibria 3 When Saturation Occurs… • Heterogeneous Nucleation • Supersaturations very small in atmosphere • Drop size distribution sensitive to size distribution of cloud condensation nuclei 4 This image is from public domain (released by the United States Navy). 5 Precipitation Formation • Stochastic coalescence (sensitive to drop size distributions) • Bergeron-Findeisen Process • Strongly nonlinear function of cloud water concentration • Time scale of precipitation formation ~10-30 minutes 6 Stability No simple criterion based on entropy. But air inside ascending cumulus turrets has roughly the same density as that of it environment. It can be shown that neutral stability corresponds to the constancy of the saturation entropy s*: T p q *(T , p) L s* c ln R ln p T d p v T 0 0 7 Tropical Soundings 8 Average density difference between reversibly lifted parcels and their environments, deep Tropics 9 “Air-Mass” Showers: This image from the book entitled "Divine wind: the history and science of hurricanes" (author is Kerry Emanuel) is copyrighted © Oxford, NY: Oxford University Press, 2005 and used with permission. 10 This image (published on Journal of Meteorology by the American Meteorological Society) is copyright © AMS and used with permission. 11 12 Precipitating Convection favors Widely Spaced Clouds (Bjerknes, 1938) This image from the book entitled "Divine wind: the history and science of hurricanes" (author is Kerry Emanuel) is copyrighted © Oxford, NY: Oxford University Press, 2005 and used with permission. 13 14 Properties of Moist Convection • Convective updrafts widely spaced • Surface enthalpy flux equal to vertically integrated radiative cooling c pT M Q • z • Precipitation = Evaporation = Radiative Cooling • Radiation and convection highly interactive 15 Simple Radiative-Convective Model Enforce convective neutrality: T1 T2 T , Ts T2 2T 16 TOA : T2 Te T1 Te T , Ts Te 2T Surface : Fs Ts 4 Te 4 T14 Layer 2 : 2 Te 4 T14 Fc Define x T Te , 4 4 Fs Te 1 1 x 1 2 x , 4 4 Fc Te 2 1 x 4 17 Manabe and Strickler 1964 calculation: 18 Effect of Moist Convective Adjustment on Climate Sensitivity 19 Flux of water by convection makes real problem complex 20 This image has been removed due to copyright restrictions. 21 Image courtesy of NASA. 22 Frequency histogram of rawindsonde relative humidities from 1600 ascents at the tropical Pacific islands of Yap, Koror, Ponape and Majuro, January-May, 1994-95. Spencer and Braswell, Bull. Amer. Meteor. Soc., 1997. This image (published on Bull. Amer. Meteor. Soc. by the American Meteorological Society) is copyright © AMS and used with permission. 23 Effects of Clouds on Radiative Transfer • Responsible for much of Earth’s albedo • Important greenhouse effect from longwave absorption and re-emission 24 Globally Averaged Energy Balance Climate Change 2007: The Physical Science Basis. Working Group I Contribution to the Fourth Assessment Report of the Intergovernmental Panel on Climate Change, FAQ 1.1, Figure 1. Cambridge University Press. Used with permission. 25 26 Figure by MIT OpenCourseWare. 27 Humidity Profiles - Annual 15 Altitude (km) 10 5 0 0 5 10 15 20 Specific Humidity (g/kg) 10S - 10N 40 - 50N 70 - 84N 28 Image by MIT OpenCourseWare. Radiative-Convective Model • Band-averaged radiation • Radiation interacts with H20, CO2, O3, clouds • Two-stream approximation: radiation assumed to travel vertically • Moist convection whenever instability exists • Convection transports H20, enthalpy • Representation of layered clouds 29 Open MATLAB Type “run_model” • • • • • • • • • • • • • • 1) Restart from last run? [n] 2) Interactive radiation? [y] 3) Interactive clouds? [y] 4) Interactive surface temp? [n] 5) Time-dependent radiation? [n] 6) Date-dependent radiation? [n] 7) Diurnal-average radiation? [n] 8) Annual-average radiation? [y] 9) Surface albedo [0.32] 10) Amount of CO2 [360 ppm] 11) End time of integration [100 days] 12) Graphics averaging time [1 days] 13) Frequency of radiation calls [3 hours] 14) Frequency of graphics output [2 hours] • 0) Run model with current configuration. 30 Suggested Experiments • Annual cycle: Average results over 365 days, run for 5x365=1825 days; repeat with double CO2. Allow interactive surface temperature • Do same but without interactive clouds • Same as first bullet above, but test sensitivity to surface albedo • Same as above, but without interactive clouds 31 MIT OpenCourseWare http://ocw.mit.edu 12.340 Global Warming Science Spring 2012 For information about citing these materials or our Terms of Use, visit: http://ocw.mit.edu/terms.
