III. Flow Around Bends: Meander Evolution

12.163/12.463 Surface Processes and Landscape Evolution
K. Whipple September, 2004
III. Flow Around Bends: Meander Evolution
1. Introduction
Hooke (1975) [paper available] – first detailed data and measurements about what happens around meander bends – how flow velocity and shear stress fields develop in the bend to address: why erosion on the outer bank? Why deposition on the inner bank? What controls bend morphology? What sets meander migration rates?
Results limited by laboratory setting, however. Paper motivates Dietrich et al. to study a carefully selected natural setting: Muddy Creek, Wyoming. Chosen because: nice freeform meanders, undisturbed, sandy bed with active, readily observable transport, small enough to thoroughly document, and (key) constant near-bankfull snow-melt discharge
(annual and predictable timing) which allows observation at near steady conditions.
Dietrich et al (1979) [paper available] used a large array of micro-velocimeters and bridges to study the flow without disturbing the flow or bedforms.
This lecture summarizes the major elements of the understanding of flow, transport, and erosion processes in the evolution of meander bends developed in these pioneering studies. I will go through a simplified case emphasizing the first-order effects to draw a physical, intuitive picture of the operative processes. To do this I will step through each factor that influences the patterns of velocity and shear stress in the bend.
Note that a more detailed analysis has been completed in the years since 1980 – a fairly rich literature.
2. Preliminaries: Conservation of Mass (Sediment): “Erosion Equation”:
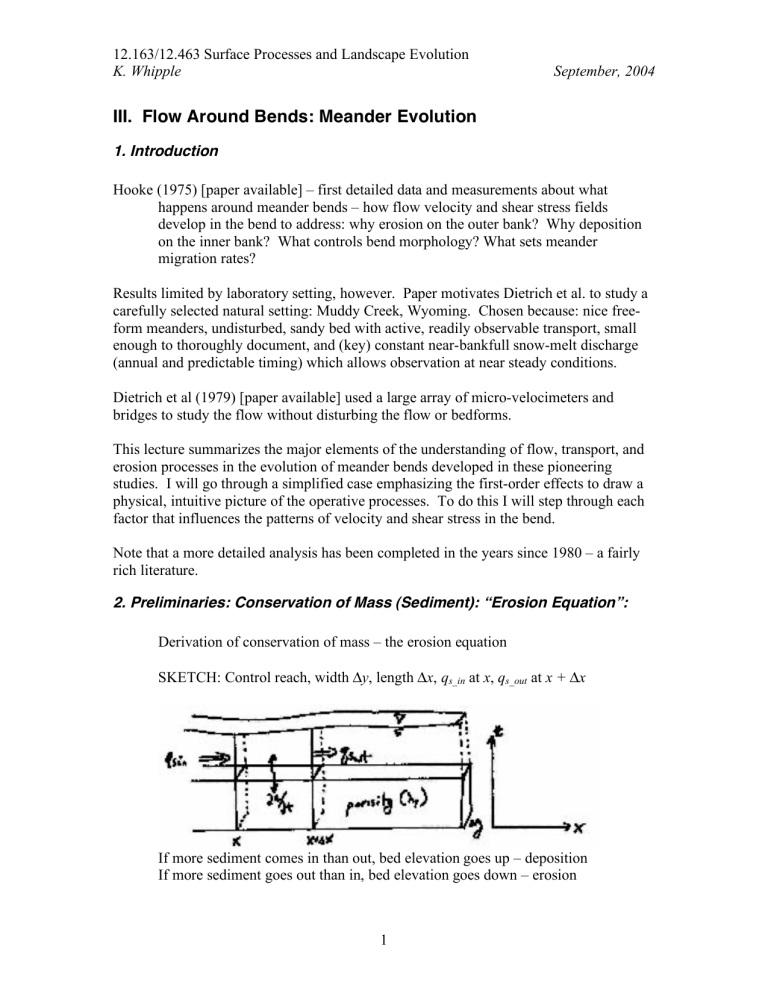
Derivation of conservation of mass – the erosion equation
SKETCH: Control reach, width
Δ y , length
Δ x , q s_in at x , q s_out at x +
Δ x
If more sediment comes in than out, bed elevation goes up – deposition
If more sediment goes out than in, bed elevation goes down – erosion
1
12.163/12.463 Surface Processes and Landscape Evolution
K. Whipple per unit time
Δ t , sediment volume in = q s_in
Δ t
Δ y per unit time
Δ t , sediment volume out = q s_out
Δ t
Δ y
Change in sediment volume per unit time
!
V s
= q s _ in
!
t
!
y
" q s _ out
!
t
!
y
September, 2004
Change in bed volume per unit time
#
V bed
= # x
# y
# z
=
1
#
"
V s
!
p
= q s _ in
# t
# y
1
"
" q s _ out
!
p
# t
# y
For change in bed elevation, divide through by
Δ x
Δ y
Δ t :
' z
' t
!
z
!
t
=
=
"
1
1
&
$$% q s
1
!
q
( ) p
!
x s
_ in
(
' x q s _ out
#
!!"
= (
1
( )
%
$
& ' q
' x s
"
!
#
Note from basics of sediment transport that q s
= f
Accordingly, we can expand the erosion equation using the chain rule:
!
z
!
t
= "
1
!
!
q
# s b
!
#
( )
!
x b
Thus we can see immediately that erosion will occur in regions of increasing shear stress (i.e., not necessarily in regions of high shear stress) and deposition will occur in regions of decreasing shear stress (not necessarily low shear stress).
3. Flow and Sediment Transport around a Simple Bend
Posit the following “Model” channel as an initial condition: mobile bed, flat channel floor, straight sections leading into and out of a bend with a circular arc, steady flow, horizontal cross-stream water surface, and no downstream variation in Q w
, w , h , u (other than direction).
SKETCH: High shear stress on inner bank
2
12.163/12.463 Surface Processes and Landscape Evolution
K. Whipple September, 2004
Effects on flow due to bend:
1. High shear stress on the inner bank because shorter distance around bend means the water surface is slightly steeper.
2. The flow experiences a radial acceleration around the bend. The centrifugal force acts in proportion to the mean velocity:
!
u 2 r c where r c is a minimum at the bend apex, so acceleration is greatest there.
3. Water is driven across the channel by this radial acceleration until enough water piles up on the outer bank to produce a “super-elevation” sufficient to create a pressure gradient to balance the (average) centrifugal force:
!
g
" h w
=
!
u
2 r c solving for the required super-elevation:
!
h
= w u 2 r c g
3
12.163/12.463 Surface Processes and Landscape Evolution
K. Whipple September, 2004
SKETCH : Illustrate the effect of super-elevation on the pattern of shear stresses on the bed. Highest: upstream, inside; High: downstream, outside; Low:
4. Cross-channel force balance discussed above is balance for radial acceleration of mean velocity. But we know there is a velocity structure both in the vertical and cross-channel directions.
SKETCH: Cross-channel flow structure – local vertically averaged velocity must be balanced by local water surface slope (complex water surface topography, with
) .
4
12.163/12.463 Surface Processes and Landscape Evolution
K. Whipple September, 2004
SKETCH: Vertical velocity structure – near the bed but the pressure field is
" g
!
h w u
< u ; near the surface u
> at all points in vertical profile … balances the mean local radial acceleration. u ,
Near surface:
" u 2 r c
> " g
!
h w
; Near bed:
" u 2 r c
< " g
!
h w
This imbalance produces a cross-stream component of flow – outward above z =
0.4
h and inward below z = 0.4
h . Combined with downstream flow pattern, this induces the helical flow pattern characteristic of meander bends. The inward flow along the channel bed sweeps fine sediment up onto point bars, particularly at their downstream end.
This discussion has actually neglected another force in the force balance between radial acceleration and pressure gradient due to super-elevation. What is it? The cross-channel component of shear stress owing to the velocity gradient described
5
12.163/12.463 Surface Processes and Landscape Evolution
K. Whipple September, 2004 above. However, this force is usually negligible, see Dietrich et al., 1979, equation 3 and discussion on page 309.
5. Shear stress pattern and erosion/sedimentation patterns on the initially flat-bed bend.
SKETCH: Initial Erosion and deposition pattern.
Recall the Erosion Equation (conservation of mass):
!
z
!
t
= "
1
1
$
!
q s
!
# b
!
#
!
x b
Deposition will occur where shear stress is decreasing downstream; erosion where it is increasing.
Note , however, that for cohesive banks, erosion rate will scale with local shear stress – focused where shear stresses are highest, as opposed to where they are increasing most rapidly for the mobile bed.
6
12.163/12.463 Surface Processes and Landscape Evolution
K. Whipple September, 2004
Effects:
A. Impingement of high velocity core on outer bank due to flow inertia will increase shear stresses on the bank (recall shear stress depends on the velocity gradient, both laterally and vertically), potentially leading to erosion of the cohesive bank.
B. Rapidly increasing shear stress along the outer bank leads to initial scour of the bed along the outer bank. This can undermine the bank and promote bank collapse.
C. Rapidly decreasing shear stress along the inner bank leads to initial deposition of a proto-point bar along the inner bank.
D. The onset of point bar growth causes a deflection of the flow across the channel. This “topographic steering” of the flow enhances bar deposition and bank erosion (positive feedback). Eventually the bar diverts flow and sediment transport around the side so effectively that the bar stops growing, at least until bank erosion promotes renewed deposition on the point bar (or vice versa).
E. At the upper end of the point bar, the topographic steering strongly suppresses helical flow (water at the bed is most strongly forced to the outer bank, easily counteracting the pressure force that would cause helical return flow. The inward sweep of the helical flow is thus delayed until the downstream end of the point bar and moves fine sediment out of the pool and up onto the point bar. This sets up a strong down-stream fining on point bars.
7
12.163/12.463 Surface Processes and Landscape Evolution
K. Whipple September, 2004
SKETCH: flow pattern and sediment size.
Viewgraphs: Figures from Hooke, 1975 and Dietrich et al., 1979 illustration flow velocity and shear stress distributions around point bars.
4. Generalized Momentum Equations Used in Dietrich et al., 1979
Their Equation 1: will look a bit familiar, but will be confusing or unclear without explanation.
From your lecture notes on flow mechanics, we derived the momentum equation for a 1dimensional flow (changes only in the downstream, or x-direction).
"
$ u
$ t
+ " u
$ u
$ x
= % " g
$ h
$ x
%
# b h
+ " g sin
!
The first confusing thing is the i, j notation. This is just a compact way to denote that this equation actually represents a set of three equations, for the momentum balance in each of the x-, y-, and z-directions (downstream, cross-stream, and in the vertical). Simply
8
12.163/12.463 Surface Processes and Landscape Evolution
K. Whipple September, 2004 understanding the x-direction equation for a flow that varies only in the downstream direction (as derived in lecture) is sufficient.
The second confusing thing is the cos (g,j) term. This simply denotes the cosine of the angle between the j-direction and the vertical (orientation of gravity). This is just a compact, general way to indicate the appropriate component of the gravitational stress in each of the x-, y-, and z-directions. gravity vector is equal to g sin
!
For example, the x-direction component of the
, as we have discussed in lecture.
The third confusion thing is that the signs on the three terms on the right hand side of the equation are all the opposite of the relation we derived. This is simply because technically g is a vector quantity that points downward, i.e., the gravitational acceleration is negative! In our derivations we implicitly used g to denote the absolute value of the
So breathe deep and relax when you encounter their equation 1. By the time you get to
Equation 2 on the second page, they will have reduced everything to the 1-d, steady, uniform flow condition we have discussed. All of the most useful discussion in this insightful paper is cast in terms of the dominant forces and greatly reduced mathematics, much as we have emphasized in lecture.
9


