Working with Map Projections in ArcGIS
advertisement
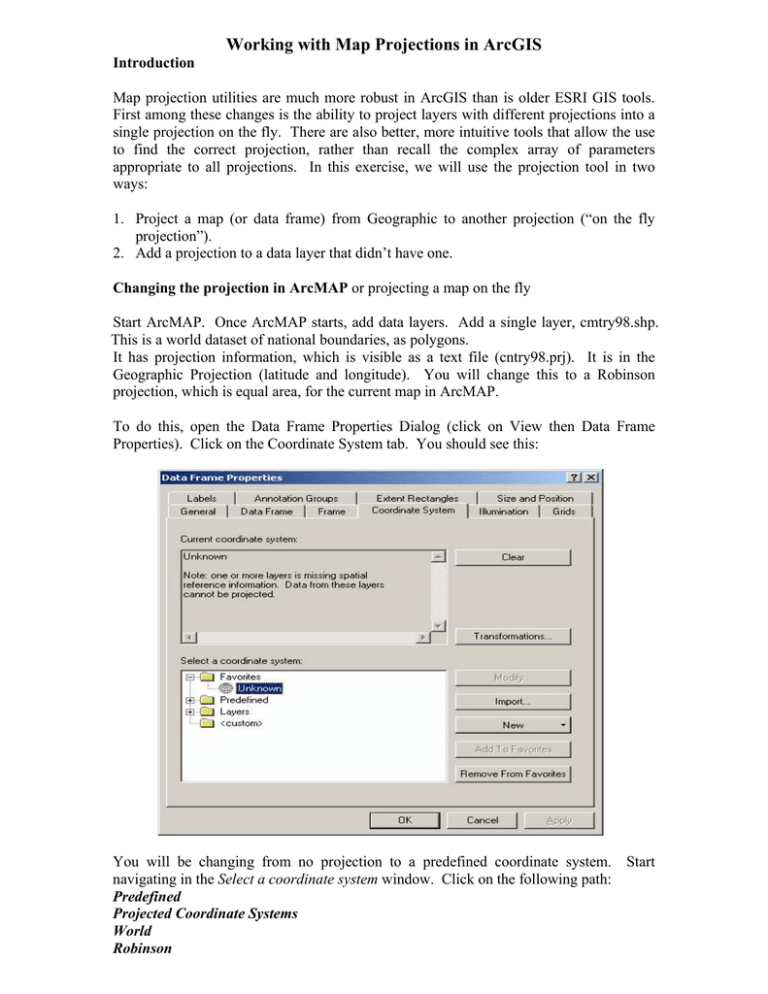
Working with Map Projections in ArcGIS Introduction Map projection utilities are much more robust in ArcGIS than is older ESRI GIS tools. First among these changes is the ability to project layers with different projections into a single projection on the fly. There are also better, more intuitive tools that allow the use to find the correct projection, rather than recall the complex array of parameters appropriate to all projections. In this exercise, we will use the projection tool in two ways: 1. Project a map (or data frame) from Geographic to another projection (“on the fly projection”). 2. Add a projection to a data layer that didn’t have one. Changing the projection in ArcMAP or projecting a map on the fly Start ArcMAP. Once ArcMAP starts, add data layers. Add a single layer, cmtry98.shp. This is a world dataset of national boundaries, as polygons. It has projection information, which is visible as a text file (cntry98.prj). It is in the Geographic Projection (latitude and longitude). You will change this to a Robinson projection, which is equal area, for the current map in ArcMAP. To do this, open the Data Frame Properties Dialog (click on View then Data Frame Properties). Click on the Coordinate System tab. You should see this: You will be changing from no projection to a predefined coordinate system. Start navigating in the Select a coordinate system window. Click on the following path: Predefined Projected Coordinate Systems World Robinson Click on OK. Your window should look like this: Click on OK. You should see this message: Click on Yes. Your map should change to the correct projection. You may have to right click on the cntry98.shp and then click on zoom to layer. The projection may draw slowly for large datasets since it is doing the projection on the fly for every coordinate. This involves multiple calculations and is time (CPU) intensive. If this is a problem, you should be projecting your data before you map rather than relying on “on the fly projections”. Adding a projection to a shapefile Try adding the roads.shp shapefile. Can you see it? Try right clicking on roads and then clicking on zoom to layer. Can you see it now? Zoom out a few times until you can recognize the geography. Is it in the right place? It should be in Massachusetts, not Africa! It is in Africa because the projection converts latitude and longitude to X and Y values. These values may be very similar for very different projections. You need to assign a projection so that data will be placed correctly on your map. Since you don’t own this file, you will need to export the data in ArcMAP. Right click on roads then click on Data then click on Export Data. You will need to complete the dialog by saving the shapefile to a folder where you have write permission (H: drive). Name it roads.shp. You should not add this to the ArcMAP table of contents because ArcToolbox will see that another program is already accessing it. Now add a projection to this shapefile so that ArcMAP knows how to display it. ArcToolbox contains the tools for doing this. Start ArcToolbox from the Start menu, clicking on ArcGIS, then clicking on ArcToolbox. This is what you should see, depending on what tools you already opened (ArcToolbox remembers it’s last state). Notice the “+” symbols, which means there are tools hidden below the topic: ________________________________________________________________________ This version already has categories expanded so you may have to click on Data Management Tools and then Projections to see this. Open up the Define Projection Wizard (shapefiles, geodatabases) and you should see this: Browse for the roads shapefile then click next. In the next dialog, click on Select Coordinate System. You should see this dialog: You need to select a predefined coordinate system. Click on select and navigate to Projected Coordinate Systems, State Plane, and NAD83. Double click on Massachusetts Mainland and you should see this: Click on OK. Now click next on the Wizard, which should now show you your selected projection, finally click finish. Now add this to the map. Where is it? Go to the Full Extent of the map (the globe on the Tools toolbar). It should be in Massachusetts. Try zooming in to see where it is. Even though these datasets are in different projections, you can see them on the map – but only because each of the datasets has a defined projection.
