DISSOLVED INORGANIC CARBON SPECIES
Speciation of Inorganic Carbon in Aqueous
Phase as a Function of pH
Relative abundance of species
1.0
0.9
0.8
0.7
0.6
CO2
0.5
HCO3-
2-
CO3
0.4
0.3
0.2
0.1
0.0
3
4
5
6
7
8
9
10
11
pH
Image by MIT OpenCourseWare.
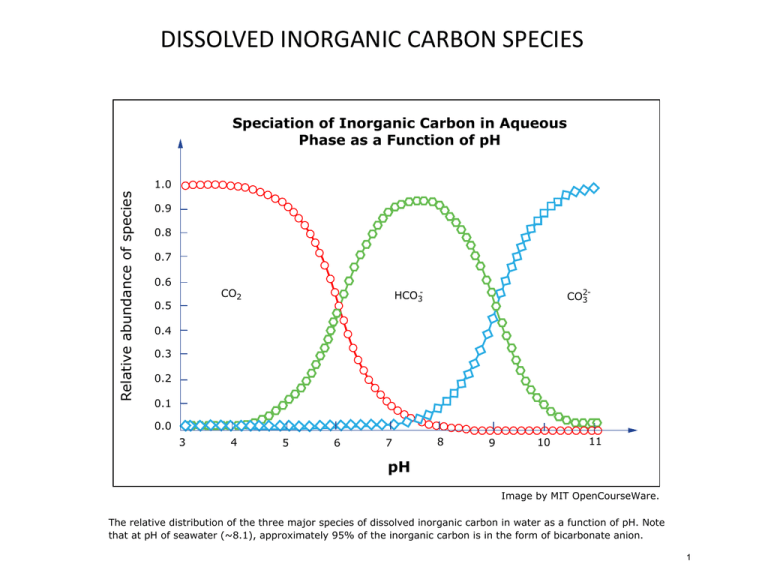
The relative distribution of the three major species of dissolved inorganic carbon in water as a function of pH. Note
that at pH of seawater (~8.1), approximately 95% of the inorganic carbon is in the form of bicarbonate anion.
1
Carbon Cycle Fluxes and δ13C Values
Atmosphere
778 (-7‰)
102
5
100
60
62
122
Surface Ocean
Fossil Fuels
Land biota
600 (1‰)
5,000 (-25‰)
1,600 (-25‰)
35
36
60
Dissolved bicarbonate
Terrestrial soils
deep ocean
1,600 (-25‰)
36,000 (0‰)
0.3
0.05
0.5
Organic C in seds/rocks
Marine carbonate seds
15,000,000 (-25‰)
2,500 (0‰)
0.7
Atmosphere
0.2
Carbonate rocks
0.03
0.05
0.06-0.7
778 (-7‰)
60,000,000 (0-1‰)
0.7
Mantle
324,000,000 (-5‰)
Continental Crust
7,000,000 (-5‰)
FLUXES IN GIGATONS OF CARBON/YEAR
2
These tables have been removed due to copyright restrictions. Please see Table 3.1 and 3.2
in the book: Fundamentals of Geobiology. ISBN: 9781405187527.
3
Redox reactions
Concepts: thermodynamic basis of microbial growth, sources of energy for microbial
growth, utilization of natural chemical and light gradients, chemical profiles in aquatic
environments and sediments, microbial processes and redox evolution of the
environment, prediction of metabolisms supported by different environments, the
influence of pH and environmental redox state on the formation of minerals
Reading: Brock Biology of Microorganisms, Morel and Hering, Aquatic chemistry,
Oremland et al. The microbial arsenic cycle in Mono Lake, California (2004), Lavik et al.
(2009), Dolfing et al. (2008)
4
This image has been removed due to copyright restrictions. Please see the image on
http://www.awi.de/fileadmin/user_upload/News/Press_Releases/2008/3._Quartal/Sedimentkerne_p.jg.
5
http://soundwaves.usgs.gov/2012/10/images/Methane3SulfidicMudDES-lg.jpg
6
Image courtesy of DOE.
(Kessler et al., 2011)
7
Acid-mine drainage
Image courtesy of NASA.
Thiobacillus ferooxidans
This image has been removed due to copyright restrictions. Please see the image on:
http://www.torinoscienza.it/img/200x200/it/s00/00/0004/0000048c.png.
8
Energy
PhotoChemo-
Electrons
Carbon
OrganoLithoOrganoLitho-
HeteroAutoHeteroAuto-
Mixotrophs: mixed sources of energy/carbon
9
ATP – energy currency of the cell
10
ATP SYNTHASE
This image has been removed due to copyright restrictions. Please see the image on:
http://www.bio.davidson.edu/courses/molbio/molstudents/spring2005/carlson/atp%20synthase1.html.
11
Redox reactions- terminology
•
Redox couple: any pair of species that have the same element in different
oxidation states is a redox couple
•
Faraday constant: charge of 1 mole of electrons (96500 C)
•
Standard free energy of a reaction: 1 mole of reactants, std. conditions
•
Reductant: e- donor
•
Oxidant: e- acceptor
•
Oxidation: loss of e-
•
Reduction: gain of e12
5 rules for determining the formal charge of an atom
1. The elementary state has a redox state of 0
H2, O2, S0
2. The oxidation state is equal to an ion’s charge
Fe3+ = 3, H+ = 1
3. In most compounds… O = -2 and H = +1
4. A neutral molecule has zero net redox state
H2O
5. A charged species has net redox state equal to its charge
OH- = -1
13
Steps for balancing redox reactions
1.
2.
3.
4.
5.
6.
7.
8.
9.
Write the unbalanced half-reactions for the oxidation and reduction
Balance all elements other than H and O
Balance O with H2O molecules
Balance H with H+ ions
Balance charge with eBalance number of e- in two half-reactions
Add the two half-reactions
Adjust for pH if necessary
Check that charge and atoms balance
14
pe
Adapted from The
Carl Sagan Lecture
By Joe Kirschvink
pe0
P680+
P680*
CH2O
CO2
–10 CO2
+
+
H2
H
+
N2
NH4
CH4 CO2
H2S S
H2S
2+
Fe
0
H
H2
+
N2 NH4
CO2 CH4
S
H2S
2–
SO42–
SO4
Fe(OH)3
CH2O
0
-
H2S
2+
Fe(OH)3
Fe
OXIDATION
+
–
+
NH4
NO3
NO3
NO2
Mn2+
CO
NO3
MnO2
CO2
NO2
NO3
MnO2
Mn2+
CO2 CO
N2 NO3–
H2O O2
NH4
–
+10
–
NO3
O2
+
P680
N2
H2O
P680
Courtesy of Joe Kirschvink. Used with permission.
+
15
Energy
PhotoChemo-
Electrons
Carbon
OrganoLithoOrganoLitho-
HeteroAutoHeteroAuto-
Mixotrophs: mixed sources of energy/carbon
16
The electron tower generally explains porewater chemistry
Lake Michigan Sediment
Black Sea
17
Example of an anaerobic metabolism: Microbial growth in Mono Lake, CA
© Google. All rights reserved. This content is excluded from our Creative Commons license.
For more information, see http://ocw.mit.edu/help/faq-fair-use/.
18
Image courtesy of USGS.
19
Image courtesy of State of California.
20
This table has been removed due to copyright restrictions. Please see Table 3B-2 on page
http://www.monobasinresearch.org/images/mbeir/dchapter3/table3b-2.pdf.
21
This image has been removed due to copyright restrictions. Please see Figure 3 (a) on page
http://onlinelibrary.wiley.com/doi/10.1016/j.femsec.2003.12.016/full.
22
These images have been removed due to copyright restrictions. Please see Figure 3 (b) and
(c) on page http://onlinelibrary.wiley.com/doi/10.1016/j.femsec.2003.12.016/full.
23
This table has been removed due to copyright restrictions. Please see Table 2 on page
http://onlinelibrary.wiley.com/doi/10.1016/j.femsec.2003.12.016/full.
(Oremland et al., 2004)
24
2
Lactate- +2HAsO4- + H+
Acetate- +HCO3- +2H2AsO3(∆G’0 = -156.8 kJ mol-1).
Image by MIT OpenCourseWare.
(Oremland et al., 2004)
25
MIT OpenCourseWare
http://ocw.mit.edu
12.007 Geobiology
Spring 2013
For information about citing these materials or our Terms of Use, visit: http://ocw.mit.edu/terms.

