i- c; 0")"P- V Li-c
advertisement
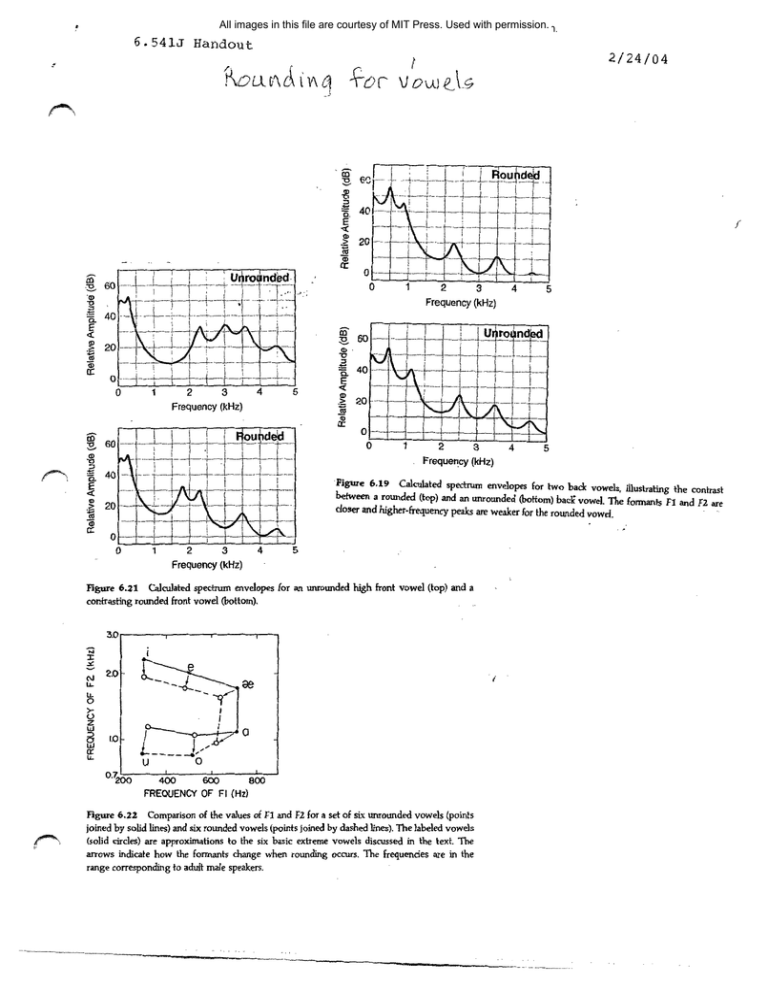
All images in this file are courtesy of MIT Press. Used with permission. t 6.541J Handout 2/24/04 L ,P\0aC" e c; 0")"P- A V Li-c r 1 F r- ` 'n C-V - -- -o ._ -~ 'tL' -- E I _ , , , _F.ou ded '-i .... I: I_ / . .- I > 0 Uronded .60~- 0 1 1 , ---4-+n ! Vt 2 Xi" I,. Frequency (kHz) 40 *- 0---r i- 20 0 0* - 5 4 3 2 1 0 Frequency (kHz) . E 0 cr .... --- ..I 60 i. i----t-- O' -de d Frequency (kHz) 40 _ $ ! . L_ 20_ 00 4 2 t iI Figure 6.19 Calculated spectrum envelopes for two back vowels, illustrating the contrast between a rounded (top) and an unrounded (bottom) back vowel. The formants Fl and F2 are closer and higher-frequency peaks are weaker for the rounded vowel. -:.------'-- 4(kHz) 3 2 Frequency I 5 Frequency (kHz) Figure 6.21 Calculated spectrum envelopes for an unrounded high front vowel (top) and a contrasting rounded front vowel (bottom). -- 3.0 ------ i P r 2: c'! - - ----- 2.0 Li. 0 zw C) U- -o.72; ,d~b~.? -�-----�I-� 0 I.0 U I o -- 0 J... 800 600 400 FREQUENCY OF Fl (Hz) Figure 6.22 Comparison of the values of F1 and F2 for a set of six unrounded vowels (points joined by solid lines) and six rounded vowels (points joined by dashed lines). The labeled vowels (solid cirdes) are approximations to the six basic extreme vowels discussed in the text. The arrows indicate how the formants change when rounding occurs. The frequencies are in the range corresponding to adult male speakers. �------------------------- ----3----- -- ' 6I e- 1\ -k I/\ T~~~e~s·-jd~~C C LP_-*) 3J i['!)' A j5\ ua Figure 6.23 Comparing midsagittal vocal tract configurations for tense and lax high vowels for a speaker of American English. (Data from Perkell, 1969.) I LL -L 0 / 0 Uo LL FREQUENCY OF Fl (Hz) Figure 6.24 Comparison of the values of F1 and F2 for the basic set of six tense vowels (dosed circles) and the four non-low lax vowels /i E u/ (open circles). Arrows point from tense vowels to corresponding lax vowels. Data are appropriate for adult male speakers. For the high vowels, data are from American English (Peterson and Barney, 1952). For the vowels /e E a o/, data are estimates from measurements of vowels in English, Italian, aid Korean, and for any one language the pair /e e/ or /o o/ may shift somewhat relative to the position shown in the figure. The point for the 'lax" low vowel /a/ is arbitrarily placed between /a/ and /a/. -a)viel nasci kt L9 1\ 6.29 Midsagittal section of the vocal tract for the nasal vowel fo/ produced by a speaker of French. (From Bothorel et al., 1986.) -Figure Un Bp Bm Figure 6.30 Schematization of the shapes of the vocal and nasal tracts for a nasal vowel. The volume velocities LU,,U,, and U,, at the glottis, nostrils, and mouth are shown, as are the acous­ tic susceptances at the coupling point looking into the pharynx (Be), the nasal cavity (B,), and the mouth cavity (B,). ~ ~ ~~ ~ ---------------- ~ ~ ~ ~ ~ ~ ~ ~~~- _T _- __ 1 1 I -I beet - o I 100 200 se ­ 300 40D 50 Tw (") )- - ¢ ~~pru~-9," I w to a ii , tn oV 0 a IOaV '0 o 4c fq i 5 A E - a _I r! IrY l ]I- I_ k-k-A S ' b =j!!,s _I -Wi S i - _ F- . :l E ~dm 7­ _ _ A- OA IM I ,-"~ - Ir -AW-- I AU6 :l oI IL-1-L I , - P ~-. -�I------------� - ~ ------------ ·---- ­ e elp w MT,,J-v e- C. n 'nac& v b)w e · 't) - , I -) O3 n3 FREQUENCY (kHz) Figure 6.32 Estimates of the acoustic susceptance B., looking into the nasal cavity for several values of the cross-sectional area of the velopharyngeal opening. U E In - *O V) -r) Ld L, 0 ) FREQUENCY (kHz) (b) (a) Figure 6.37 Estimated susceptance curves as in figure 6.33, except that the articulatory con­ figurations correspond to the two nasalized back vowels // and /a/. For the vowel // (a), the velopharyngeal area is 0.3 cm2 . For the vowel a/ (b), two sets of curves are shown, one for a velopharyngeal area A,, of 0.3 cm 2 and the other for 0.8 cm2 . Details of calculations for these vowels are given in table 6.3. _______ __ ~ --- ~ ;I"---- 1- ____I�_ _ 1_1 �s Na.L a \,i6,j A r o i .Z 324 7. Figure 6.43 768e game as figure 6.42, except that the speaker is an adult male. . ,.~~~~~~~~~~1 Figure 6.42 Spectrograms and spectra illustrating nasalized vowels and their non-nasal cog­ nates in English for a female speaker. The spectrograms at the top are the utterances dot bend (left) and don's bed (right). The spectra immediately elow the spectrograms are sampled in the non-nasal /a/ in dot at the left and the nasalized /a/ in don at the right. The spectra at the bottom are sampled in the non-nasal /e/ in bed (left) and the nasalized /e/ in bend (right). � I � ___ �I��
