CENSUS
SNAPSHOT
CALIFORNIA’S BLACK LGB POPULATION
OCTOBER 2008
Christopher Ramos
Gary J. Gates, Senior Research Fellow
This report provides a general overview of
Black individuals in same-sex couples as well
as the broader Black lesbian, gay, and
bisexual (LGB) population in California.1
We use data from the 2005/2006 American
Community Survey (ACS), conducted by the
U.S. Census Bureau, to compare the
characteristics of Black people in same-sex
couples to their different-sex married
counterparts. In all cases, when this report
describes characteristics of couples, the data
source is the ACS. While the ACS provides an
excellent source of information about those in
same-sex couples, it cannot provide
information about the larger Black LGB
population since it includes no explicit
question about sexual orientation.
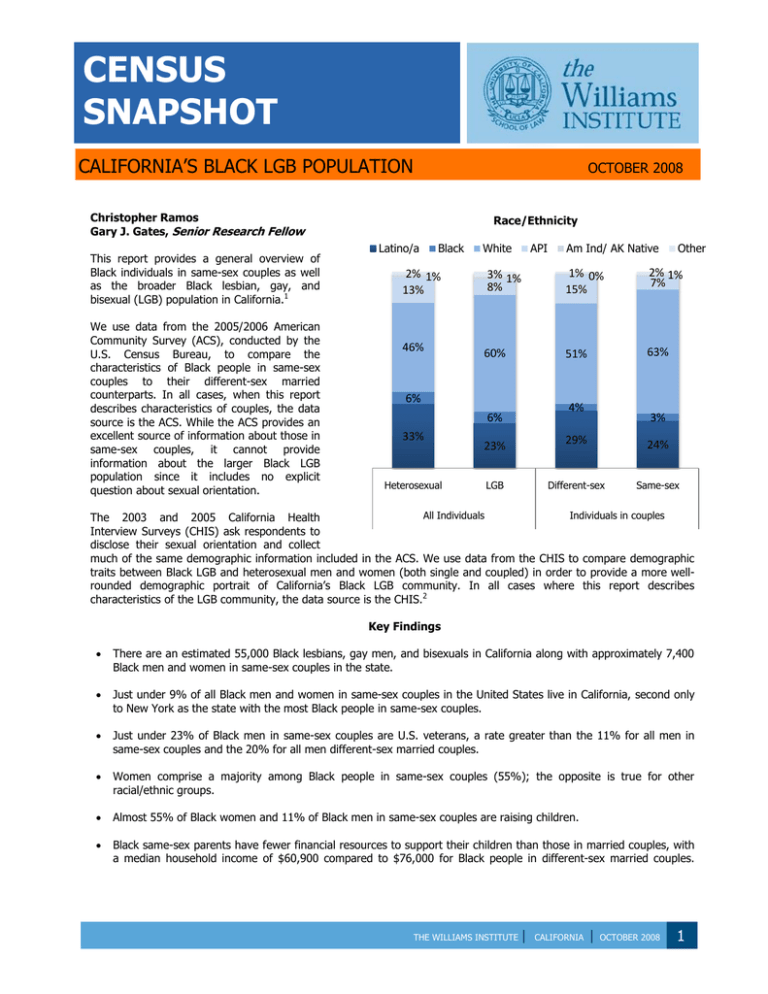
Race/Ethnicity
Latino/a
Black
White
API
Am Ind/ AK Native
Other
2% 1%
13%
3% 1%
8%
1% 0%
15%
2% 1%
7%
46%
60%
51%
63%
6%
4%
6%
33%
Heterosexual
23%
LGB
3%
29%
24%
Different-sex
Same-sex
All Individuals
Individuals in couples
The 2003 and 2005 California Health
Interview Surveys (CHIS) ask respondents to
disclose their sexual orientation and collect
much of the same demographic information included in the ACS. We use data from the CHIS to compare demographic
traits between Black LGB and heterosexual men and women (both single and coupled) in order to provide a more wellrounded demographic portrait of California’s Black LGB community. In all cases where this report describes
characteristics of the LGB community, the data source is the CHIS.2
Key Findings
There are an estimated 55,000 Black lesbians, gay men, and bisexuals in California along with approximately 7,400
Black men and women in same-sex couples in the state.
Just under 9% of all Black men and women in same-sex couples in the United States live in California, second only
to New York as the state with the most Black people in same-sex couples.
Just under 23% of Black men in same-sex couples are U.S. veterans, a rate greater than the 11% for all men in
same-sex couples and the 20% for all men different-sex married couples.
Women comprise a majority among Black people in same-sex couples (55%); the opposite is true for other
racial/ethnic groups.
Almost 55% of Black women and 11% of Black men in same-sex couples are raising children.
Black same-sex parents have fewer financial resources to support their children than those in married couples, with
a median household income of $60,900 compared to $76,000 for Black people in different-sex married couples.
THE WILLIAMS INSTITUTE
|
CALIFORNIA
|
OCTOBER 2008
1
MORE THAN 55,000 BLACK LESBIAN, GAY, AND
BISEXUAL ADULTS LIVE IN CALIFORNIA; 7,394
BLACK INDIVIDUALS ARE IN SAME-SEX COUPLES
There are an estimated 55,000 LGB Black adults 1
in
California, comprising 3.2% of Black adults in
California.
Black individuals make up 6.4% of the state’s total
LGB population versus 6.0% of the total
heterosexual population.
A similar percentage of those in same-sex couples
and different-sex married couples are Black, 6.4%
and 6.5% respectively.
LGB BLACK INDIVIDUALS ARE ACTIVE
PARTICIPANTS IN CALIFORNIA’S ECONOMY
The percent employed among Black people in
1
same-sex couples is 77%, significantly larger than
the 66% for those in different-sex married couples.
The percentage of LGB Black individuals who are
employed (74%) also exceeds that of Black
heterosexuals (64%).
LGB BLACK PEOPLE HAVE RELATIVELY HIGH
LEVELS OF EDUCATION
Black individuals in same-sex couples are
significantly more likely to have a college degree
(37% vs. 28%) than their different-sex married
counterparts.
LGB AND HETEROSEXUAL BLACK PEOPLE ARE
SIMILAR IN AGE
Approximately 38% of Black men and women in
same-sex couples are aged 18-39 compared to 45%
of Black men and women in different-sex marriages.
Similarly, LGB Black people are more likely than
their heterosexual counterparts to have a college
degree (36% versus 25%).
Of LGB Black people, 47% are aged 18-39 compared
to 45% of Black heterosexuals.
LGB Black men and women have lower rates of
college education when compared to the 47% of all
LGB Californians who hold at least a college degree.
LGB BLACK INDIVIDALS ARE MORE URBAN THAN
THEIR HETEROSEXUAL COUNTERPARTS
Almost 90% of LGB Black people live in urban areas
compared to 81% of Black heterosexuals.
Black heterosexuals are slightly more likely to live in
a suburban area (15%) than their LGB (9%)
counterparts; 4% of Black heterosexuals live in rural
areas compared to 1% of LGB Black people.
BLACK INDIVIDUALS IN SAME-SEX COUPLES ARE
MORE LIKELY TO BE IN AN INTERRACIAL OR
INTER-ETHNIC RELATIONSHIP
About 80% of Black individuals in married differentsex couples are with another Black person,
compared to only 49% of Black people in same-sex
couples.
LGB BLACK INIDIVIDUALS HAVE ACTIVELY
SERVED IN THE UNITED STATES MILITARY
Despite the military’s historic policies of excluding
LGB people from service, 23% of Black men in
same-sex couples are veterans, a rate greater than
the 11% for all men in same-sex couples and the
20% for all men different-sex married couples; 5%
of Black women in same-sex couples have served in
the military, a larger percentage than the 3% of
Black women in married heterosexual couples.
Eleven percent of Black LGB males have served in
the military along with 14% of Black LGB women.
BLACK PEOPLE IN SAME-SEX COUPLES AND
THOSE IN MARRIED DIFFERENT-SEX COUPLES
HAVE SIMILAR EARNINGS
WOMEN COMPRISE A MAJORITY OF BLACK
PEOPLE IN SAME-SEX COUPLES YET MEN ARE
OVERLY REPRESENTED IN THE BLACK LGB
POPULATION AT-LARGE
Black women in same-sex couples have median
individual earnings of $37,000 while the median
earnings for Black women in different-sex married
couples are $35,000.
A unique sex difference exists among Black men and
women in same-sex couples; 55% are women and
45% are men; the reverse is true for all other
racial/ethnic groups and the entire LGB population.
Men make up a larger percentage of the overall
Black LGB population, (57% to 43%).
Black men in same-sex couples have average
individual earnings of $53,421 versus $52,252 for
Black men in different-sex married couples; their
median earnings are $47,000 and $44,000,
respectively.
THE WILLIAMS INSTITUTE
2
|
CALIFORNIA
|
OCTOBER 2008
2
Median Household income: Black
Population
$45,000
$45,000
2
The LGB Black homeownership rate is 30%,
significantly less than the 44% home ownership
rate for Black heterosexuals.
Black people, regardless of sexual orientation, are
all less likely to own their homes than the total
heterosexual population, 57% of whom own their
homes.
$35,000
MANY BLACK MEN AND WOMEN WITHIN SAMESEX COUPLES ARE RAISING CHILDREN
$25,000
Men
Approximately 11% of Black men within same-sex
couples and 55% of Black women within same-sex
couples are raising children under the age of 18,
compared to the 55% of those in married differentsex couples.
Among all Black LGB individuals, both single and
coupled, 2% of men and 39% of women are raising
children. The rate for Black women is much higher
than that for the overall LGB population, in which
25% of women are raising children.
Women
Heterosexual
LGB
MEDIAN HOUSEHOLD INCOME FOR
HETEROSEXUAL BLACK MEN EXCEEDS THAT OF
BLACK LGB MEN
BLACK SAME-SEX PARENTS ARE RAISING
CHILDREN WITH FEWER ECONOMIC RESOURCES
THAN DIFFERENT-SEX MARRIED PARENTS
Gay/Bisexual Black men have a median household
income of $25,000 compared to the $45,000 of
heterosexual Black males.
Black same-sex parents have limited financial
resources to support their children with a median
household income of $60,900 compared to $76,000
for Black married couples.
Lesbian/bisexual Black women have a median
household income of $45,000 versus $35,000 of
heterosexual Black females.
Black parents are also less likely than Black
different-sex married parents to own their homes
(29% vs. 63%).
LGB Black individuals have lower median household
incomes than the larger gay/bisexual and
heterosexual population, both at $55,000.
Average individual earnings show much more
similarity; Gay/Bisexual Black men earn $53,421
versus the $52,452 of their heterosexual
counterparts and Lesbian/Bisexual Black women
earning $40,985 versus $41,772 for their
heterosexual counterparts.
Household income: Blacks in couples
raising children
$85,415 $85,636
$76,000
$60,900
BLACK INDIVIDUALS IN SAME-SEX COUPLES
AND WITHIN THE LARGER LGB POPULATION IN
CALIFORNIA HAVE LOWER HOME OWNERSHIP
RATES
Black people in same-sex couples have a
homeownership rate of 59% compared to 66%
among Black people in different-sex married
couples.
Average household
income
Same-sex couples
THE WILLIAMS INSTITUTE
|
Median household income
Different-sex married couples
CALIFORNIA
|
OCTOBER 2008
3
Table One: Characteristics of Black individuals in California
California Health Interview Survey
2003/2005, Age 18-70
LGB
American Community Survey
In a
same-sex couple
Heterosexual
In a different-sex
married couple
Sex
Male
Female
57.3%
42.7%
46.1%
53.9%
44.8%
55.2%
54.8%
45.2%
11.9%
34.8%
52.8%
16.4%
28.8%
50.2%
17.9%
27.0%
57.4%
-
4.6%
1.0%^
36.5%
58.8%
4.7%^
89.7%*
9.2%
1.2%*
81.0%
15.4%
3.6%
36.1%
24.9%
37.1%^
28.2%
73.9%
64.1%
76.5%^
66.3%
$25,000
$45,000
$45,000
$35,000
Men
$53,421
$52,252
Women
$40,985
$41,772
Men
$47,000
$44,000
Women
$37,000
$35,000
Average age
18-24
25-39
40-64
65+
Place of residence
Urban
Suburban
Rural
Percent with a college
degree or better
Percent Employed
Median Household
Income
Men
Women
Average individual
salary
13.8%
Median individual
salary
Veteran Status
Men
11.0%*
27.9%
22.8%
Women
14.3%
2.4%
4.6%
Homeownership
30.0%*
44.1%
59.0%
Percent with children
under 18
Men
2.3%*
32.9%
10.8%^
Women
39.0%*
41.8%
54.8%
* Difference significant from heterosexuals at the 5% level or better (two-tailed tests).
^ Difference significant from different-sex married couples at the 5% level or better (two-tailed tests).
30.4%
2.5 %
65.7%
55.0%
55.0%
Table Two: Characteristics of Black individuals in couples with children, ACS only
In a same-sex couple
In a different-sex couple
Average household income (parents)
$85,415
$85,636
Median household income (parents)
$60,900
$76,000
Homeownership
28.7%^
62.7%
* Difference significant from heterosexuals at the 5% level or better (two-tailed tests).
^ Difference significant from different-sex married couples at the 5% level or better (two-tailed tests).
THE WILLIAMS INSTITUTE
|
CALIFORNIA
|
OCTOBER 2008
4
1
Characteristics of California’s gay/lesbian, bisexual, and heterosexual population are derived from the 2003 and
2005 California Health Interview Survey (CHIS). The CHIS is conducted by the UCLA Center for Health Policy
Research in collaboration with the California Department of Public Health, the Department of Health Care Services
and the Public Health Institute. It is funded by public agencies and private organizations. It is considered a
representative sample of the California population. Adults aged 18-70 are asked their sexual orientation along with
a variety of questions about their demographic, economic, and health characteristics. In most cases, we combine
samples from 2003 and 2005 to increase sample sizes and accuracy for the lesbian, gay, and bisexual respondents.
CHIS surveyed over 40,000 California households in each of those years. Estimates of demographic characteristics
for individuals in couples are made using an average of the 2005 and 2006 data of the Census Bureau’s American
Community Survey Public Use Microdata Samples (PUMS). The American Community Survey contains detailed
information about all members of the household, including citizenship, country of origin, and a variety of
demographic and economic characteristics.
About the Authors
Christopher Ramos is a Research Assistant at the Williams Institute, UCLA School of Law. B.A. Pomona College.
He studies social inequality through a lens of race, class, gender, and sexual orientation.
Gary J. Gates is Senior Research Fellow at The Williams Institute, UCLA School of Law. Ph.D Carnegie Mellon. He
studies the demographic and economic characteristics of the lesbian and gay population.
For more information, contact:
The Williams Institute
UCLA School of Law
Box 951476
Los Angeles, CA 90095-1476
T (310)267-4382
F (310)825-7270
williamsinstitute@law.ucla.edu
www.law.ucla.edu/williamsinstitute
6
THE WILLIAMS INSTITUTE
|
CALIFORNIA
|
OCTOBER 2008
5

