Document 13494410
advertisement
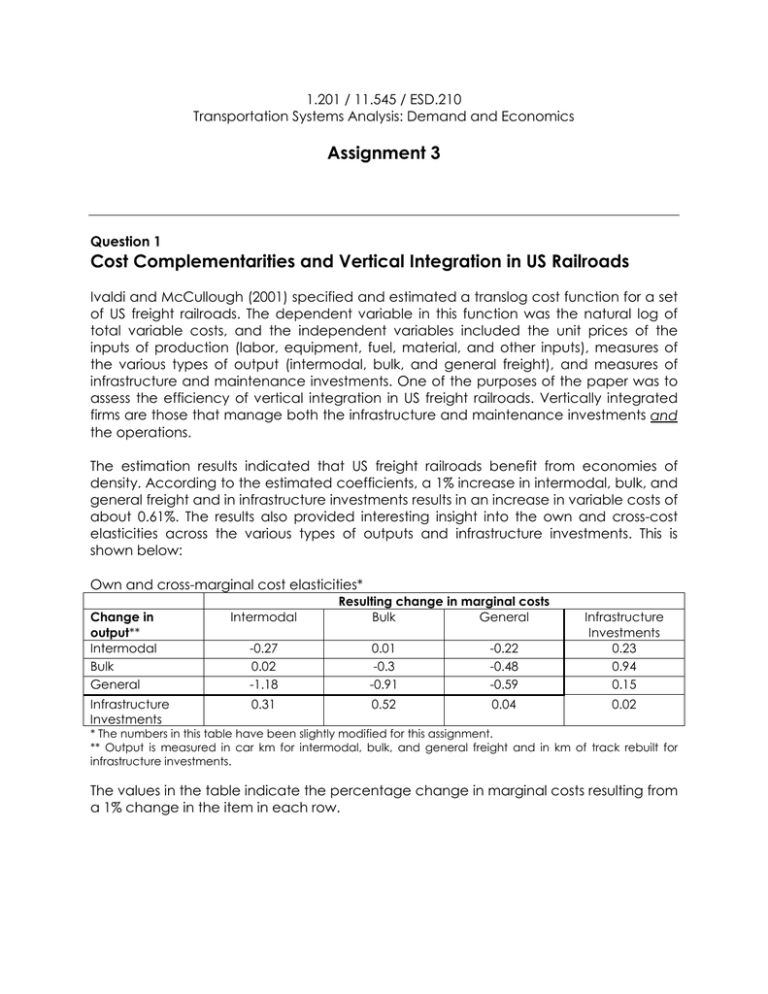
1.201 / 11.545 / ESD.210 Transportation Systems Analysis: Demand and Economics Assignment 3 Question 1 Cost Complementarities and Vertical Integration in US Railroads Ivaldi and McCullough (2001) specified and estimated a translog cost function for a set of US freight railroads. The dependent variable in this function was the natural log of total variable costs, and the independent variables included the unit prices of the inputs of production (labor, equipment, fuel, material, and other inputs), measures of the various types of output (intermodal, bulk, and general freight), and measures of infrastructure and maintenance investments. One of the purposes of the paper was to assess the efficiency of vertical integration in US freight railroads. Vertically integrated firms are those that manage both the infrastructure and maintenance investments and the operations. The estimation results indicated that US freight railroads benefit from economies of density. According to the estimated coefficients, a 1% increase in intermodal, bulk, and general freight and in infrastructure investments results in an increase in variable costs of about 0.61%. The results also provided interesting insight into the own and cross­cost elasticities across the various types of outputs and infrastructure investments. This is shown below: Own and cross­marginal cost elasticities* Change in output** Intermodal Bulk General Infrastructure Investments Intermodal Resulting change in marginal costs Bulk General ­0.27 0.02 ­1.18 0.01 ­0.3 ­0.91 ­0.22 ­0.48 ­0.59 Infrastructure Investments 0.23 0.94 0.15 0.31 0.52 0.04 0.02 * The numbers in this table have been slightly modified for this assignment. ** Output is measured in car km for intermodal, bulk, and general freight and in km of track rebuilt for infrastructure investments. The values in the table indicate the percentage change in marginal costs resulting from a 1% change in the item in each row. Answer the following questions: [Keep in mind that the values in the table represent elasticities with respect to marginal (not total) costs with respect to changes in output.] a. As mentioned above, there are economies of density when we consider a proportional increase in all outputs, as well as infrastructure investments. Do economies of density also exist for individual types of outputs (i.e. intermodal, bulk, and general freight separately)? Support your answer with estimates from the table. b. Describe any cost complementarities or anti­complementarities that you see across the various output types and infrastructure investments in the table. Briefly discuss why you think such relationships exist? c. Minimizing costs requires prioritizing business decisions related to infrastructure and maintenance investments and operations. This, in turn, requires coordination among various entities. Based on your answer in (b), do you think vertical integration would be efficient in US freight railroads? In other words, would total costs be minimized if infrastructure and maintenance investment decisions were made within the same company that operates the railroad, or would it be better to have two separate entities, one for operations and the other for infrastructure and maintenance investments? 2 Question 2 An Urban Travel Choice Model with Transit Service Attributes Part I Consider the following urban travel choice situation: MIT students are attending a subject taught at the Kennedy School of Government in the spring semester which meets Tuesday and Thursday mornings from 10:30 to noon. These students do not have access to automobiles and in any case would be unable to park close to the Kennedy School in mid­morning so their choices for getting to and from the Harvard class are: 1. Access MBTA bus route #1, alight at Harvard Square, and walk from there to the Kennedy School. 2. Walk to Kendall Square, take the MBTA Red Line to Harvard and walk from there. 3. Walk from MIT to the Kennedy School. A recent study has estimated the following utility function for mode choice which could be applied to this choice scenario: Vi = −0.17 * IVTT − 0.42 *TA − 0.29 *WT − 2.00 * COST IVTT: In­vehicle travel time (minutes) TA: Access or walk time (minutes) WT: Wait time (minutes) COST: Fare (dollars) Note: 1) Mean in­vehicle travel times (IVTT) and wait times (WT) were used to estimate this utility function. 2) The scale parameter in the logit function µ, is 1.0 Data has been analyzed to derive the following level of service attributes for the relevant services at the time of day of interest: Function A: PDF of in­vehicle travel time (IVTT) for MBTA bus route #1 3 Probability 0.2 0 10 13 20 Minutes Function B: PDF of wait time for MBTA bus route #1 Probability 0.1 0 8 20 Minutes Function C: PDF of in­vehicle travel time (IVTT) for MBTA Red Line Probability 0.4 0 8 13 Minutes 4 Function D: PDF of wait time for MBTA Red Line Probability 0.2 0 4 10 Minutes Answer the following questions: a. What are the choice probabilities for each of the three defined alternatives above? Make all necessary assumptions, including walking travel times and state them clearly. b. How do the choice probabilities change if a student has i. An MBTA Bus pass? ii. An MBTA LinkPass? c. How do the choice probabilities change if the MBTA adopts a new fare structure of $1.75 for any transit trip? d. What are the choice probabilities if the student must be on time (i.e. arrive with probability 1 at or before the start of class)? e. Critically assess the utility function given above. f. Are there likely to be any equilibrium effects which might affect this particular problem? In other words, is the performance of the services likely to be sensitive to the choices? Explain. 5 Part II In this part, you are asked to develop a choice model for another urban travel situation. A group of MIT students have bought tickets to attend a Boston Red Sox game at Fenway Park. As in the example above, their trip must start in room 1­235 at MIT. The students do not have access to automobiles and, therefore, have the following options: 1. Access MBTA bus route #1, alight at Massachusetts Avenue and Beacon Street, and walk from there to Fenway Park. 2. Walk to Kendall Square, take the MBTA Red Line to Park Street, take the Green Line, and alight at Kenmore. 3. Walk from MIT to Fenway Park. (There may be other options that involve public transit, but you are only required to consider the ones listed above.) Answer the following question: Develop a model that characterizes the choice being made by the students. Use the following guidelines: 1. Start by developing a conceptual framework. What factors would affect the choice we are considering? Keep in mind that the example in part (I) above was very simplistic and did not account for many factors, such as those related to the individuals traveling. 2. Define a set of measures that you can use for each of the factors you have specified. Do not worry about data availability. Assume you have access to all the data you need, but make sure you clearly state what your variables are and the units by which they are measured. 3. Specify your model by defining a set of utility functions (one for each alternative). As you do so, you need to determine what variables require generic versus alternative­ specific coefficients (for example, will a minute travel time on the #1 bus cause the same disutility as a minute of travel time on the Red Line). You also need to keep in mind that socioeconomic characteristics and alternative­specific constants can only be included in at most (J­1) utility functions, where J is the number of available alternatives. Please use the simple logit structure for your model (not nested logit). 4. Discuss your a priori expectations. What are the signs that you expect each coefficient to have? For coefficients that are comparable (i.e. those that have the same units: utils/minute, for example), discuss which ones you think would be larger than others. 5. Discuss the differences likely to arise in the return trip (from Fenway Park back to MIT). How do you expect the coefficients and the choice probabilities for each mode to change compared to the ones in the model you have just developed? Please keep your answer to this part limited to no more than three pages. 6 MIT OpenCourseWare http://ocw.mit.edu 1.201J / 11.545J / ESD.210J Transportation Systems Analysis: Demand and Economics Fall 2008 For information about citing these materials or our Terms of Use, visit: http://ocw.mit.edu/terms.
