Propeller Performance
advertisement

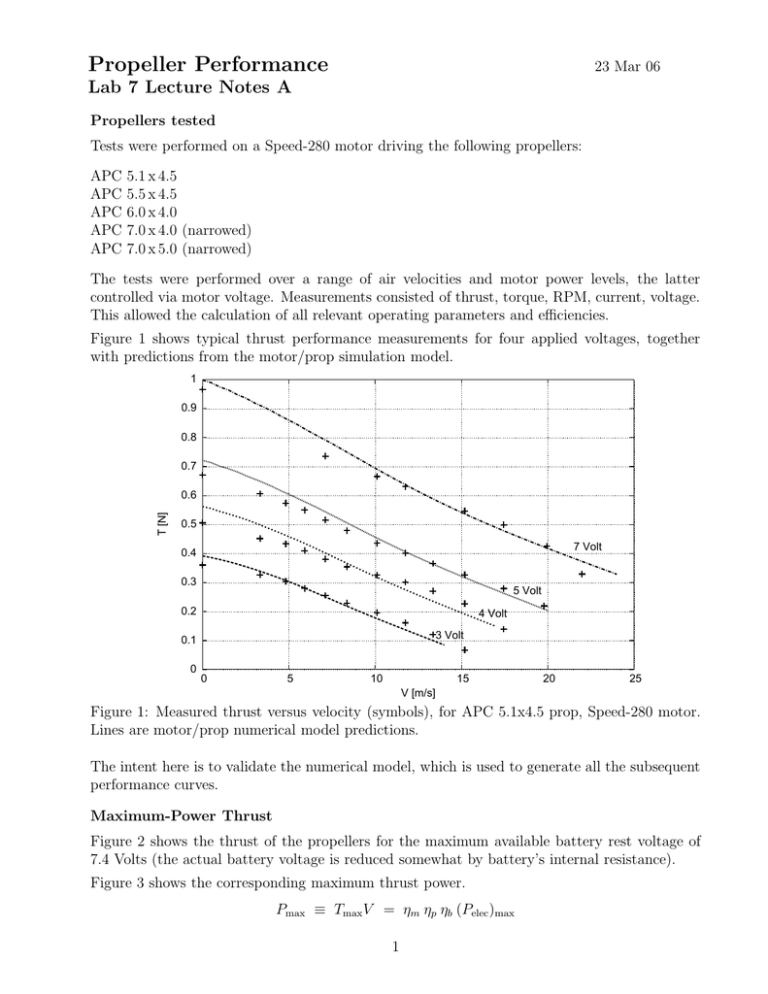
Propeller Performance 23 Mar 06 Lab 7 Lecture Notes A Propellers tested Tests were performed on a Speed-280 motor driving the following propellers: APC APC APC APC APC 5.1 x 4.5 5.5 x 4.5 6.0 x 4.0 7.0 x 4.0 (narrowed) 7.0 x 5.0 (narrowed) The tests were performed over a range of air velocities and motor power levels, the latter controlled via motor voltage. Measurements consisted of thrust, torque, RPM, current, voltage. This allowed the calculation of all relevant operating parameters and efficiencies. Figure 1 shows typical thrust performance measurements for four applied voltages, together with predictions from the motor/prop simulation model. 1 0.9 0.8 0.7 T [N] 0.6 0.5 7 Volt 0.4 0.3 5 Volt 0.2 4 Volt 3 Volt 0.1 0 0 5 15 10 20 25 V [m/s] Figure 1: Measured thrust versus velocity (symbols), for APC 5.1x4.5 prop, Speed-280 motor. Lines are motor/prop numerical model predictions. The intent here is to validate the numerical model, which is used to generate all the subsequent performance curves. Maximum-Power Thrust Figure 2 shows the thrust of the propellers for the maximum available battery rest voltage of 7.4 Volts (the actual battery voltage is reduced somewhat by battery’s internal resistance). Figure 3 shows the corresponding maximum thrust power. Pmax ≡ Tmax V = ηm ηp ηb (Pelec )max 1 1 "apc51x45.74vb" u 1:4 "apc55x45.74vb" u 1:4 "apc60x40.74vb" u 1:4 "apc70x50n.74vb" u 1:4 "apc70x40n.74vb" u 1:4 0.8 T [N] 0.6 0.4 0.2 0 0 5 10 15 20 25 V [m/s] Figure 2: Maximum thrust versus velocity, for 7.4 Volt, 0.30 Ohm battery. 9 "apc51x45.74vb" u 1:17 "apc55x45.74vb" u 1:17 "apc60x40.74vb" u 1:17 "apc70x50n.74vb" u 1:17 "apc70x40n.74vb" u 1:17 8 7 TV [W] 6 5 4 3 2 1 0 0 5 15 10 20 25 V [m/s] Figure 3: Maximum thrust power versus velocity, for 7.4 Volt, 0.30 Ohm battery. Cruise-Power Efficiency For a given thrust or power, the propeller efficiency ηp varies substantially with velocity. The motor and battery efficiencies may vary as well. It is convenient to lump these into one overall efficiency. η = ηm ηp ηb 2 Figure 4 shows how this varies versus velocity for the various props. 0.4 "apc51x45.5Wb" u 1:15 "apc55x45.5Wb" u 1:15 "apc60x40.5Wb" u 1:15 "apc70x50n.5Wb" u 1:15 "apc70x40n.5Wb" u 1:15 0.35 eta_p x eta_m x eta_b 0.3 0.25 0.2 0.15 0.1 0.05 0 0 2 6 V [m/s] 4 8 10 12 Figure 4: Overall efficiency versus velocity, at Pelec = 5 W battery output. The overall efficiency will also vary somewhat with the power level, as shown in Figure 5. 0.4 "apc51x45.5Wb" u 1:15 "apc51x45.6Wb" u 1:15 "apc51x45.7Wb" u 1:15 "apc51x45.8Wb" u 1:15 0.35 eta_p x eta_m x eta_b 0.3 0.25 Pelec = 5W 0.2 8W 0.15 0.1 0.05 0 0 2 6 V [m/s] 4 8 10 12 Figure 5: Overall efficiency versus velocity, APC 5.1 x 4.5 prop, at Pelec = 5, 6, 7, 8 W battery output. Performance Modeling For optimization purposes, it is necessary to obtain simple expressions for the above prop/motor 3 performance curves. For the three best props in Figure 2, the maximum thrust is closely approximated by the simple linear curve-fit function Tmax (V ) ≃ T0 + T1 V T0 = 0.86 N T1 = −0.027 N/(m/s) (1) (2) (3) If performance calculations are to be performed in terms of thrust power rather than thrust, the performance of the best props in Figure 3 is then approximated by the following curve fit. Pmax (V ) ≃ Tmax V = (T0 + T1 V )V (4) The overall efficiency in Figure 5 is closely approximated by the curve fit � η(V ) ≃ η0 1 − (V /Vη0 − 1)2 η0 = 0.26 Vη0 = 9.0 m/s � (5) (6) (7) This Vη0 value gives the best fit to the Pelec = 6 W curve. It can be adjusted slightly if necessary. 4


