Document 13469133
advertisement
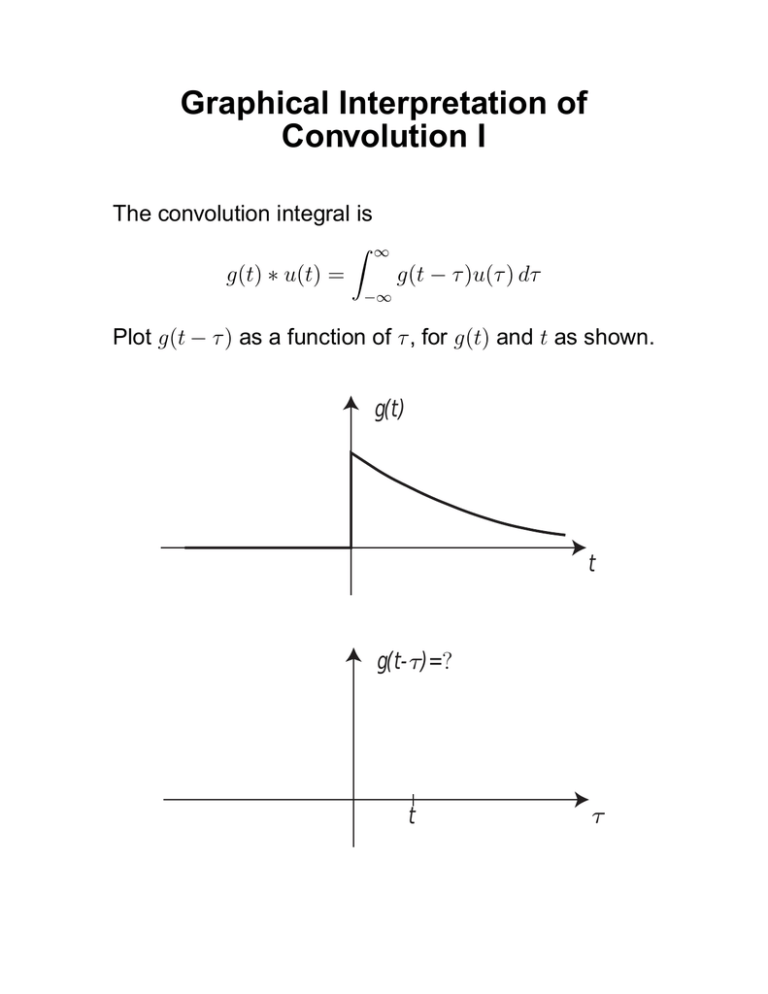
Graphical Interpretation of Convolution I The convolution integral is � ∞ g(t) ∗ u(t) = g(t − τ )u(τ ) dτ −∞ Plot g(t − τ ) as a function of τ , for g(t) and t as shown. g(t) t g(t-τ)=? t τ Graphical Interpretation of Convolution I Plot g(t − τ ) as a function of τ , for g(t) and t as shown. g(t) t My confidence that I have the correct answer is: 1. 100% 2. 80% 3. 60% 4. 40% 5. 20% 6. 0% Graphical Interpretation of Convolution I The plot of g(t − τ ) is given by g(t-τ) t My answer 1. Was completely correct 2. Was mostly correct, with one or two minor errors 3. Had many errors 4. Was completely incorrect τ Graphical Interpretation of Convolution II The signals g(t) and u(t) are as plotted below. Plot g(t − τ )u(τ ) as a function of τ . g(t) t u(t) t g(t-τ)u(τ)=? t τ Graphical Interpretation of Convolution II Plot g(t − τ )u(τ ) as a function of τ , for g(t) and u(t) as shown. g(t) u(t) t My confidence that I have the correct answer is: 1. 100% 2. 80% 3. 60% 4. 40% 5. 20% 6. 0% t Graphical Interpretation of Convolution II The plot of g(t − τ ) is given by g(t-τ)u(τ) t My answer 1. Was completely correct 2. Was mostly correct, with one or two minor errors 3. Had many errors 4. Was completely incorrect τ
