Factsheet # 19 Hyperspectral Remote Sensing of Urban Trees for Species Identification
advertisement
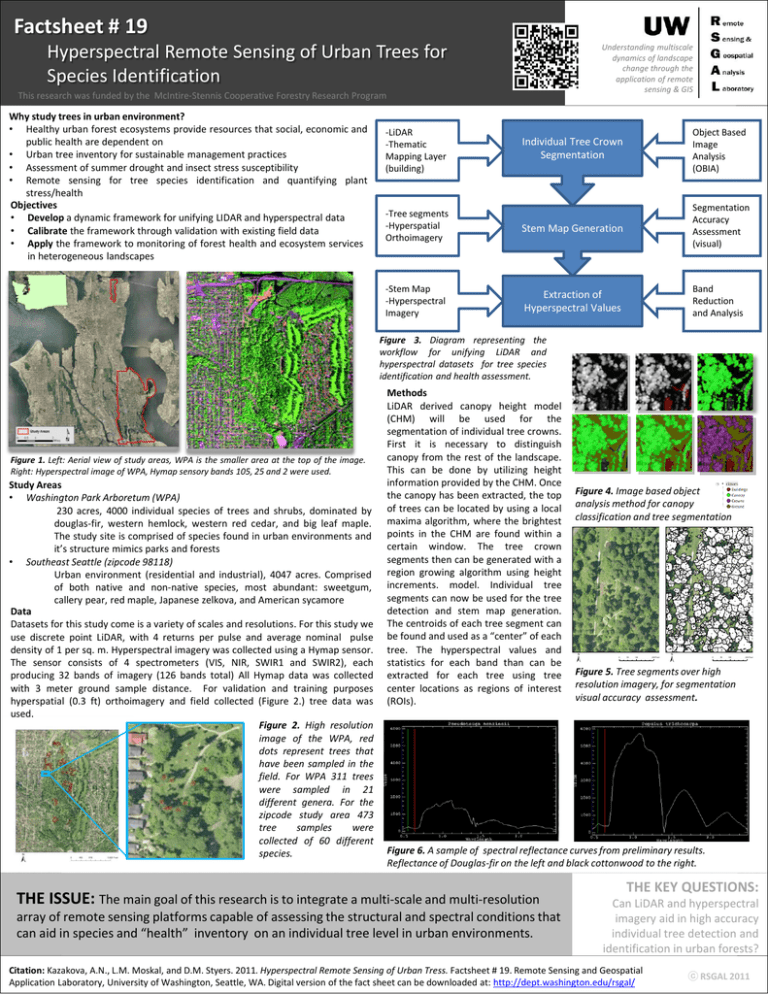
Factsheet # 19 Hyperspectral Remote Sensing of Urban Trees for Species Identification Understanding multiscale dynamics of landscape change through the application of remote sensing & GIS This research was funded by the McIntire-Stennis Cooperative Forestry Research Program Why study trees in urban environment? • Healthy urban forest ecosystems provide resources that social, economic and public health are dependent on • Urban tree inventory for sustainable management practices • Assessment of summer drought and insect stress susceptibility • Remote sensing for tree species identification and quantifying plant stress/health Objectives • Develop a dynamic framework for unifying LIDAR and hyperspectral data • Calibrate the framework through validation with existing field data • Apply the framework to monitoring of forest health and ecosystem services in heterogeneous landscapes -LiDAR -Thematic Mapping Layer (building) Individual Tree Crown Segmentation Object Based Image Analysis (OBIA) -Tree segments -Hyperspatial Orthoimagery Stem Map Generation Segmentation Accuracy Assessment (visual) -Stem Map -Hyperspectral Imagery Extraction of Hyperspectral Values Band Reduction and Analysis Figure 3. Diagram representing the workflow for unifying LiDAR and hyperspectral datasets for tree species identification and health assessment. Figure 1. Left: Aerial view of study areas, WPA is the smaller area at the top of the image. Right: Hyperspectral image of WPA, Hymap sensory bands 105, 25 and 2 were used. Study Areas • Washington Park Arboretum (WPA) 230 acres, 4000 individual species of trees and shrubs, dominated by douglas-fir, western hemlock, western red cedar, and big leaf maple. The study site is comprised of species found in urban environments and it’s structure mimics parks and forests • Southeast Seattle (zipcode 98118) Urban environment (residential and industrial), 4047 acres. Comprised of both native and non-native species, most abundant: sweetgum, callery pear, red maple, Japanese zelkova, and American sycamore Data Datasets for this study come is a variety of scales and resolutions. For this study we use discrete point LiDAR, with 4 returns per pulse and average nominal pulse density of 1 per sq. m. Hyperspectral imagery was collected using a Hymap sensor. The sensor consists of 4 spectrometers (VIS, NIR, SWIR1 and SWIR2), each producing 32 bands of imagery (126 bands total) All Hymap data was collected with 3 meter ground sample distance. For validation and training purposes hyperspatial (0.3 ft) orthoimagery and field collected (Figure 2.) tree data was used. Figure 2. High resolution image of the WPA, red dots represent trees that have been sampled in the field. For WPA 311 trees were sampled in 21 different genera. For the zipcode study area 473 tree samples were collected of 60 different species. Methods LiDAR derived canopy height model (CHM) will be used for the segmentation of individual tree crowns. First it is necessary to distinguish canopy from the rest of the landscape. This can be done by utilizing height information provided by the CHM. Once the canopy has been extracted, the top of trees can be located by using a local maxima algorithm, where the brightest points in the CHM are found within a certain window. The tree crown segments then can be generated with a region growing algorithm using height increments. model. Individual tree segments can now be used for the tree detection and stem map generation. The centroids of each tree segment can be found and used as a “center” of each tree. The hyperspectral values and statistics for each band than can be extracted for each tree using tree center locations as regions of interest (ROIs). Figure 4. Image based object analysis method for canopy classification and tree segmentation ± 0 50 100 200 Feet ± 0 50 100 200 Feet Figure 5. Tree segments over high resolution imagery, for segmentation visual accuracy assessment. Figure 6. A sample of spectral reflectance curves from preliminary results. Reflectance of Douglas-fir on the left and black cottonwood to the right. THE ISSUE: The main goal of this research is to integrate a multi-scale and multi-resolution array of remote sensing platforms capable of assessing the structural and spectral conditions that can aid in species and “health” inventory on an individual tree level in urban environments. THE KEY QUESTIONS: Can LiDAR and hyperspectral imagery aid in high accuracy individual tree detection and identification in urban forests? Citation: Kazakova, A.N., L.M. Moskal, and D.M. Styers. 2011. Hyperspectral Remote Sensing of Urban Tress. Factsheet # 19. Remote Sensing and Geospatial Application Laboratory, University of Washington, Seattle, WA. Digital version of the fact sheet can be downloaded at: http://dept.washington.edu/rsgal/ ⓒ RSGAL 2011
