Document 13449567
advertisement
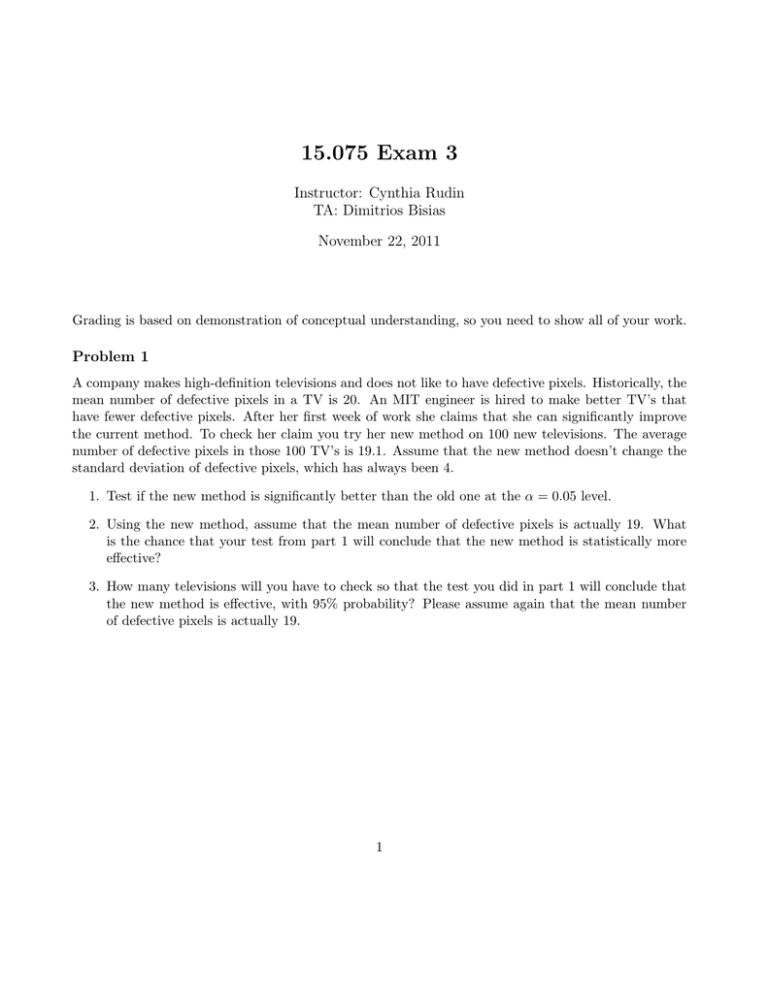
15.075 Exam 3 Instructor: Cynthia Rudin TA: Dimitrios Bisias November 22, 2011 Grading is based on demonstration of conceptual understanding, so you need to show all of your work. Problem 1 A company makes high-definition televisions and does not like to have defective pixels. Historically, the mean number of defective pixels in a TV is 20. An MIT engineer is hired to make better TV’s that have fewer defective pixels. After her first week of work she claims that she can significantly improve the current method. To check her claim you try her new method on 100 new televisions. The average number of defective pixels in those 100 TV’s is 19.1. Assume that the new method doesn’t change the standard deviation of defective pixels, which has always been 4. 1. Test if the new method is significantly better than the old one at the α = 0.05 level. 2. Using the new method, assume that the mean number of defective pixels is actually 19. What is the chance that your test from part 1 will conclude that the new method is statistically more effective? 3. How many televisions will you have to check so that the test you did in part 1 will conclude that the new method is effective, with 95% probability? Please assume again that the mean number of defective pixels is actually 19. 1 Problem 2 Two methods of memorizing words are to be compared. You choose two groups of 5 people, where the first person in the first group has the same characteristics as the first person in the second group (they have the same educational level, age, etc.). Same thing about the second person in each group - they are also similar to each other in terms of education, age, etc. Same thing for the third, fourth and fifth people from each group. The first group is assigned to the first method of memorization and the second group to the other method. The number of words recalled in a memory test after a week’s training with these two methods is shown below. Method 1 Method 2 Pair 1 25 21 Pair 2 30 20 Pair 3 22 23 Pair 4 27 18 Pair 5 29 17 Test the hypothesis that the first method is better than the second method at the 0.05 level. You may assume normality of the data. 2 Problem 3 After your MIT graduation you decide to go to Monte Carlo for vacation. You visit a casino and decide to gamble; specifically, you want to play roulette. Before you start betting, you watch 500 roulette games at the casino, and you find that red is hit 260 times. Can you determine whether the roulette is fair? In case you don’t know how roulette is played in Monte Carlo, it involves spinning a wheel that has many slots around it. There is 1 gold slot, 18 red slots, and 18 black slots. 1. Set up the hypotheses. 2. Calculate the P-value. Can you reject null hypothesis at the 0.05 level? 3. Find a 95% CI for the proportion of red results. 3 Problem 4 The weight of an object is measured using an electronic scale that reports the true weight plus a random fluctuation that is normally distributed with zero mean. The manufacturing company of the electronic scale claims that the standard deviation of the fluctuation is 2 milligrams. Assume that the fluctuations are independent. The company measures the weight of one object 8 times, and observes these values: 100.9, 98.2, 101.5, 102.2, 105.1, 99.4, 93.6, 97.5 1. You believe that the standard deviation of the fluctuation is greater than what the company claims. Is there statistically significant evidence for your belief at α = 5% level? 2. Compute a 95% confidence interval for the variance of the fluctuation. 4 Problem 5 You are an investment manager of an asset management company and you want to evaluate the perfor­ mance of two hedge funds. For this you record their past performance for the last 10 years. The returns for both of the hedge funds in different years are independent and normally distributed with unknown ¯ = 22.15% and mean and variance. The mean return for Hedge Fund 1, averaged over the 10 years, is X the standard deviation calculated from those 10 measurements is 2.79%. For Hedge Fund 2 the mean return, averaged over the 10 years, is Y¯ = 20.6% and the standard deviation calculated from those 10 measurements is 2.46%. 1. Test equality of the variances for the two hedge funds using α = 0.1. 2. Test for the equality of the means of the two hedge funds’ performances, using α = 0.05 with a suitable test. Would you recommend using a t-test calculated from a pooled variance or the method for unequal variances? If you rejected the test in (1) then you may assume the variances are unequal, otherwise you may assume that the variances are equal. 5 MIT OpenCourseWare http://ocw.mit.edu 15.075J / ESD.07J Statistical Thinking and Data Analysis Fall 2011 For information about citing these materials or our Terms of Use, visit: http://ocw.mit.edu/terms.
