Juvenile Plantations Exhibit the “Crossover” Effect F
advertisement

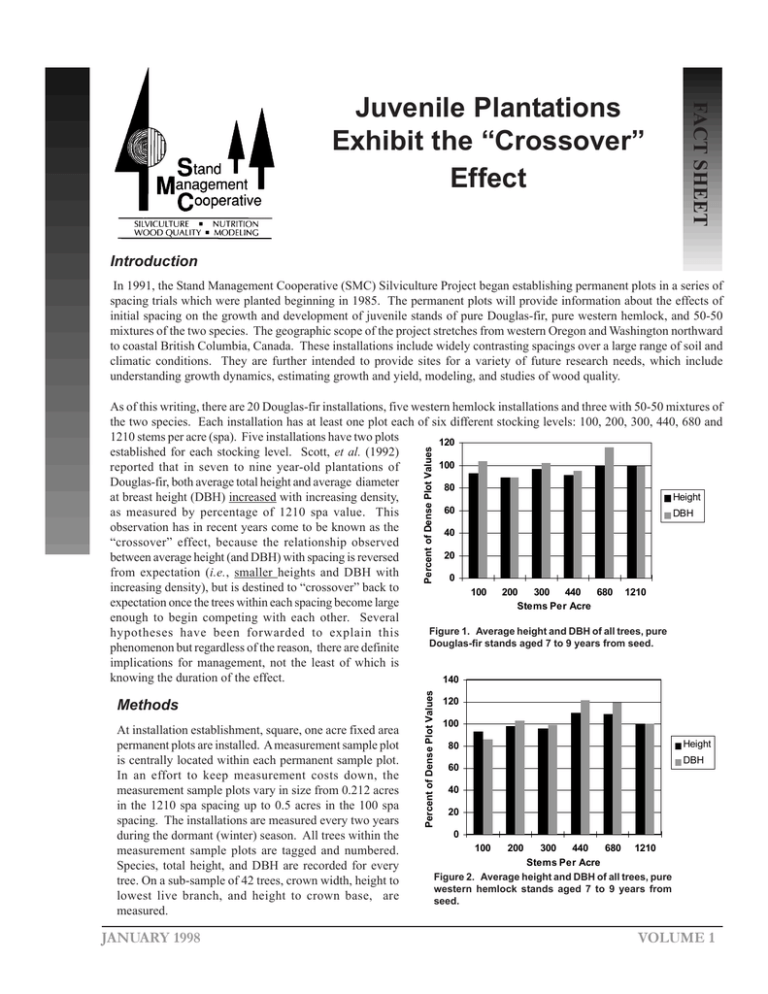
FACT SHEET Juvenile Plantations Exhibit the “Crossover” Effect Introduction In 1991, the Stand Management Cooperative (SMC) Silviculture Project began establishing permanent plots in a series of spacing trials which were planted beginning in 1985. The permanent plots will provide information about the effects of initial spacing on the growth and development of juvenile stands of pure Douglas-fir, pure western hemlock, and 50-50 mixtures of the two species. The geographic scope of the project stretches from western Oregon and Washington northward to coastal British Columbia, Canada. These installations include widely contrasting spacings over a large range of soil and climatic conditions. They are further intended to provide sites for a variety of future research needs, which include understanding growth dynamics, estimating growth and yield, modeling, and studies of wood quality. Methods At installation establishment, square, one acre fixed area permanent plots are installed. A measurement sample plot is centrally located within each permanent sample plot. In an effort to keep measurement costs down, the measurement sample plots vary in size from 0.212 acres in the 1210 spa spacing up to 0.5 acres in the 100 spa spacing. The installations are measured every two years during the dormant (winter) season. All trees within the measurement sample plots are tagged and numbered. Species, total height, and DBH are recorded for every tree. On a sub-sample of 42 trees, crown width, height to lowest live branch, and height to crown base, are measured. JANUARY 1998 Percent of Dense Plot Values Percent of Dense Plot Values As of this writing, there are 20 Douglas-fir installations, five western hemlock installations and three with 50-50 mixtures of the two species. Each installation has at least one plot each of six different stocking levels: 100, 200, 300, 440, 680 and 1210 stems per acre (spa). Five installations have two plots 120 established for each stocking level. Scott, et al. (1992) 100 reported that in seven to nine year-old plantations of Douglas-fir, both average total height and average diameter 80 Height at breast height (DBH) increased with increasing density, 60 as measured by percentage of 1210 spa value. This DBH observation has in recent years come to be known as the 40 “crossover” effect, because the relationship observed 20 between average height (and DBH) with spacing is reversed from expectation (i.e., smaller heights and DBH with 0 increasing density), but is destined to “crossover” back to 100 200 300 440 680 1210 expectation once the trees within each spacing become large Stems Per Acre enough to begin competing with each other. Several Figure 1. Average height and DBH of all trees, pure hypotheses have been forwarded to explain this Douglas-fir stands aged 7 to 9 years from seed. phenomenon but regardless of the reason, there are definite implications for management, not the least of which is knowing the duration of the effect. 140 120 100 Height 80 DBH 60 40 20 0 100 200 300 440 680 1210 Stems Per Acre Figure 2. Average height and DBH of all trees, pure western hemlock stands aged 7 to 9 years from seed. VOLUME 1 Setting the average total height or DBH of the highest stocking level as 100% and expressing the average size of each lower stocking level relative to the highest stocking level as a percent, the relationship between size and density was examined for two stand components (whole stand and 100 largest by DBH) for each species. Multiple comparisons (t-tests) were also performed on the absolute differences in DBH and height between successive pairs of plots to test for significant differences. Results Considering average total height and average DBH, there appears to be little if any regular relationship with density for Douglas-fir (Figure 1) or for western hemlock (Figure 2) in seven to nine year-old (total age) plantations. The same holds true for three to six year-old and for ten to thirteen year-old plantations of both species (not shown). Conclusion Average height and DBH of the 100 largest diametered trees per acre show significant trends with density in plantations as young as three years. It may be possible to maintain or even enhance this size increase through appropriately timed thinnings. This opportunity hinges on the presumption that the 100 largest diametered trees are well distributed throughout the plot and not clumped on one particularly good microsite within the plot. Percent of Dense Plot Values Perhaps more importantly, however, there is a definite relationship between size and density when size of the “crop” trees only are considered. Figure 3 shows that the average DBH of the 100 largest diametered trees (D100) increases monotonically from widest to narrowest spacing with relative diameters of 54%, 62%, 79%, 80%, and 97% for the 100, 200, 300, 440, and 680 spa stocking levels, respectively. For height (H100) we observe a progression of 69%, 76%, 86%, 86%, and 96% for 100 through 680 spa stocking levels, respectively. Figure 4 shows the observed relationships for western hemlock. For western hemlock there appears to be an “optimal” stocking level somewhere between 440 and 1210 spa. Based on the ttests for Douglas-fir, stocking levels 1210 and 680 spa behaved in a statistically similar fashion. The 440 and 300 stocking levels formed another group while the 200 and 100 spa levels formed the third. For western hemlock there were basically two statistically significant groups: 1210, 680, and 440 spa formed one group, and the 300, 200 and 100 spa levels formed the other. These trends for both species are continuing in the ten to thirteen year-old age group as well. 100 90 80 70 60 50 40 30 20 10 0 H100 D100 100 200 300 440 680 1210 Stems Per Acre Figure 3. H100 and D100 for pure Douglas-fir stands aged 7 to 9 years from seed. Scott, W., R. Meade, and R. Leon. 1992. Observations from 7 to 9-year-old Douglas-fir variable density plantation test beds. Forestry Research Field Notes, Weyerhaeuser Company, Timberlands Forest Resources R&D, Silviculture- West, Paper #92-2. Percent of Dense Plot Values Literature Cited 120 100 80 H100 60 D100 40 20 0 100 200 300 440 680 1210 Stems Per Acre Figure 4. H100 and D100 for pure western hemlock stands aged 7 to 9 years from seed. Stand Management Cooperative, College of Forest Resources, Box 352100, University of Washington, Seattle WA 98195 Phone (206) 543-5355


