Effects of Occasion Length on Occupancy Estimation Models Introduction Methods Michael Havrda, University of Washington – School of Environmental and Forest Sciences, Spring 2014
advertisement
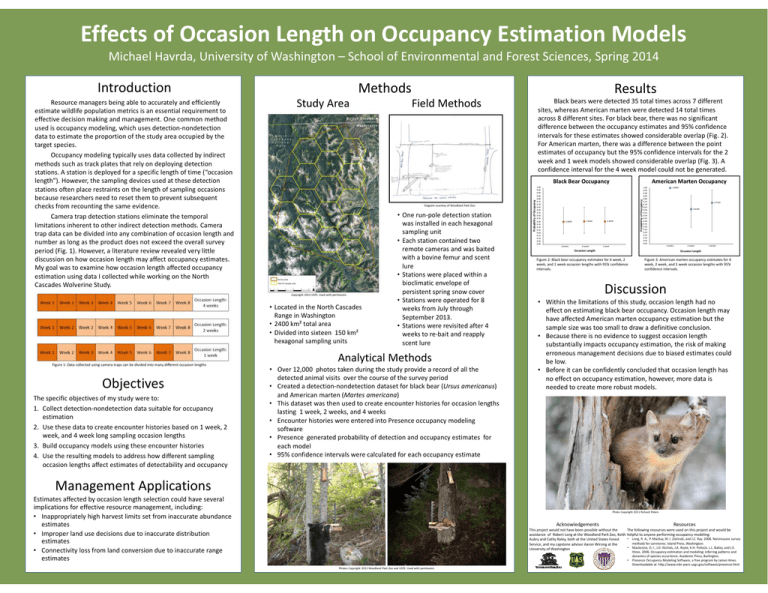
Effects of Occasion Length on Occupancy Estimation Models Michael Havrda, University of Washington – School of Environmental and Forest Sciences, Spring 2014 Introduction Study Area Objectives • One run‐pole detection station was installed in each hexagonal sampling unit • Each station contained two remote cameras and was baited with a bovine femur and scent lure • Stations were placed within a bioclimatic envelope of persistent spring snow cover • Stations were operated for 8 weeks from July through September 2013. • Stations were revisited after 4 weeks to re‐bait and reapply scent lure Analytical Methods • Over 12,000 photos taken during the study provide a record of all the detected animal visits over the course of the survey period • Created a detection‐nondetection dataset for black bear (Ursus americanus) and American marten (Martes americana) • This dataset was then used to create encounter histories for occasion lengths lasting 1 week, 2 weeks, and 4 weeks • Encounter histories were entered into Presence occupancy modeling software • Presence generated probability of detection and occupancy estimates for each model • 95% confidence intervals were calculated for each occupancy estimate 1.00 0.95 0.90 0.85 0.80 0.75 0.70 0.65 0.60 0.55 0.50 0.45 0.40 0.35 0.30 0.25 0.20 0.15 0.10 0.05 0.00 0.4000 4 weeks 0.4041 2 weeks American Marten Occupancy Probability of Occupancy Diagram courtesy of Woodland Park Zoo. • Located in the North Cascades Range in Washington • 2400 km² total area • Divided into sixteen 150 km² hexagonal sampling units The specific objectives of my study were to: 1. Collect detection‐nondetection data suitable for occupancy estimation 2. Use these data to create encounter histories based on 1 week, 2 week, and 4 week long sampling occasion lengths 3. Build occupancy models using these encounter histories 4. Use the resulting models to address how different sampling occasion lengths affect estimates of detectability and occupancy Black bears were detected 35 total times across 7 different sites, whereas American marten were detected 14 total times across 8 different sites. For black bear, there was no significant difference between the occupancy estimates and 95% confidence intervals for these estimates showed considerable overlap (Fig. 2). For American marten, there was a difference between the point estimates of occupancy but the 95% confidence intervals for the 2 week and 1 week models showed considerable overlap (Fig. 3). A confidence interval for the 4 week model could not be generated. Black Bear Occupancy Copyright 2013 USFS. Used with permission. Figure 1: Data collected using camera traps can be divided into many different occasion lengths Results Field Methods Probability of Occupancy Resource managers being able to accurately and efficiently estimate wildlife population metrics is an essential requirement to effective decision making and management. One common method used is occupancy modeling, which uses detection‐nondetection data to estimate the proportion of the study area occupied by the target species. Occupancy modeling typically uses data collected by indirect methods such as track plates that rely on deploying detection stations. A station is deployed for a specific length of time (“occasion length”). However, the sampling devices used at these detection stations often place restraints on the length of sampling occasions because researchers need to reset them to prevent subsequent checks from recounting the same evidence. Camera trap detection stations eliminate the temporal limitations inherent to other indirect detection methods. Camera trap data can be divided into any combination of occasion length and number as long as the product does not exceed the overall survey period (Fig. 1). However, a literature review revealed very little discussion on how occasion length may affect occupancy estimates. My goal was to examine how occasion length affected occupancy estimation using data I collected while working on the North Cascades Wolverine Study. Methods 0.4029 1.00 0.95 0.90 0.85 0.80 0.75 0.70 0.65 0.60 0.55 0.50 0.45 0.40 0.35 0.30 0.25 0.20 0.15 0.10 0.05 0.00 1.0000 0.7319 0.6204 4 weeks 1 week Occasion Length 2 weeks 4 weeks Occasion Length Figure 2: Black bear occupancy estimates for 4 week, 2 week, and 1 week occasion lengths with 95% confidence intervals. Figure 3: American marten occupancy estimates for 4 week, 2 week, and 1 week occasion lengths with 95% confidence intervals. Discussion • Within the limitations of this study, occasion length had no effect on estimating black bear occupancy. Occasion length may have affected American marten occupancy estimation but the sample size was too small to draw a definitive conclusion. • Because there is no evidence to suggest occasion length substantially impacts occupancy estimation, the risk of making erroneous management decisions due to biased estimates could be low. • Before it can be confidently concluded that occasion length has no effect on occupancy estimation, however, more data is needed to create more robust models. Management Applications Estimates affected by occasion length selection could have several implications for effective resource management, including: • Inappropriately high harvest limits set from inaccurate abundance estimates • Improper land use decisions due to inaccurate distribution estimates • Connectivity loss from land conversion due to inaccurate range estimates Photo Copyright 2011 Richard Peters Acknowledgements Resources This project would not have been possible without the The following resources were used on this project and would be assistance of Robert Long at the Woodland Park Zoo, Keith helpful to anyone performing occupancy modeling: • Long, R. A., P. MacKay, W. J. Zielinski, and J.C. Ray. 2008. Noninvasive survey Aubry and Cathy Raley, both at the United States Forest methods for carnivores. Island Press, Washington. Service, and my capstone advisor Aaron Wirsing at the • Mackenzie, D. I., J.D. Nichols, J.A. Royle, K.H. Pollock, L.L. Bailey, and J.E. University of Washington • Photos Copyright 2013 Woodland Park Zoo and USFS. Used with permission. Hines. 2006. Occupancy estimation and modeling: inferring patterns and dynamics of species occurrence. Academic Press, Burlington. Presence Occupancy Modeling Software, a free program by James Hines. Downloadable at http://www.mbr‐pwrc.usgs.gov/software/presence.html
