Comparison of Canopy Cover Estimation Using Densiometer and Photo Analysis Software Introduction
advertisement

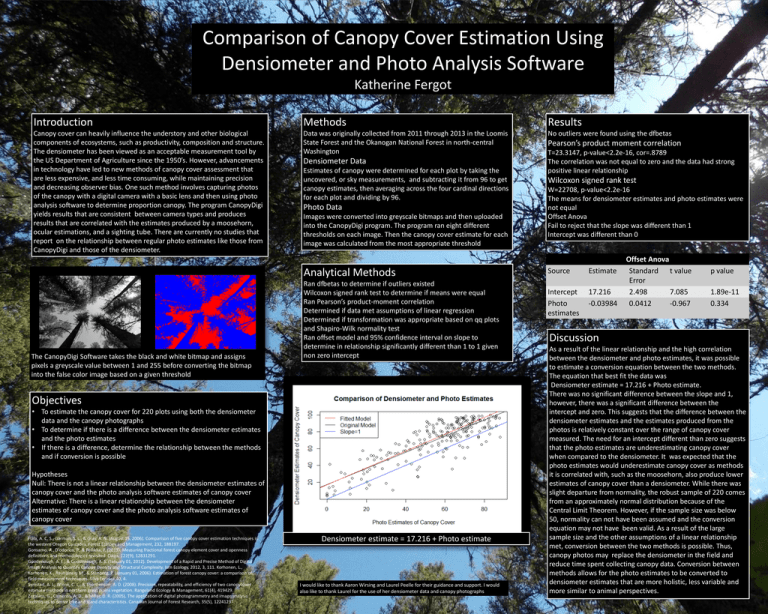
Comparison of Canopy Cover Estimation Using Densiometer and Photo Analysis Software Katherine Fergot Introduction Methods Results Canopy cover can heavily influence the understory and other biological components of ecosystems, such as productivity, composition and structure. The densiometer has been viewed as an acceptable measurement tool by the US Department of Agriculture since the 1950’s. However, advancements in technology have led to new methods of canopy cover assessment that are less expensive, and less time consuming, while maintaining precision and decreasing observer bias. One such method involves capturing photos of the canopy with a digital camera with a basic lens and then using photo analysis software to determine proportion canopy. The program CanopyDigi yields results that are consistent between camera types and produces results that are correlated with the estimates produced by a moosehorn, ocular estimations, and a sighting tube. There are currently no studies that report on the relationship between regular photo estimates like those from CanopyDigi and those of the densiometer. Data was originally collected from 2011 through 2013 in the Loomis State Forest and the Okanogan National Forest in north-central Washington No outliers were found using the dfbetas Densiometer Data Estimates of canopy were determined for each plot by taking the uncovered, or sky measurements, and subtracting it from 96 to get canopy estimates, then averaging across the four cardinal directions for each plot and dividing by 96. Photo Data Images were converted into greyscale bitmaps and then uploaded into the CanopyDigi program. The program ran eight different thresholds on each image. Then the canopy cover estimate for each image was calculated from the most appropriate threshold Analytical Methods The CanopyDigi Software takes the black and white bitmap and assigns pixels a greyscale value between 1 and 255 before converting the bitmap into the false color image based on a given threshold Ran dfbetas to determine if outliers existed Wilcoxon signed rank test to determine if means were equal Ran Pearson’s product-moment correlation Determined if data met assumptions of linear regression Determined if transformation was appropriate based on qq plots and Shapiro-Wilk normality test Ran offset model and 95% confidence interval on slope to determine in relationship significantly different than 1 to 1 given non zero intercept Objectives • To estimate the canopy cover for 220 plots using both the densiometer data and the canopy photographs • To determine if there is a difference between the densiometer estimates and the photo estimates • If there is a difference, determine the relationship between the methods and if conversion is possible Hypotheses Null: There is not a linear relationship between the densiometer estimates of canopy cover and the photo analysis software estimates of canopy cover Alternative: There is a linear relationship between the densiometer estimates of canopy cover and the photo analysis software estimates of canopy cover Fiala, A. C. S., Garman, S. L., & Gray, A. N. (August 15, 2006). Comparison of five canopy cover estimation techniques in the western Oregon Cascades. Forest Ecology and Management, 232, 188197. Gonsamo, A., D'odorico, P., & Pellikka, P. (2013). Measuring fractional forest canopy element cover and openness definitions and methodologies revisited. Oikos, 122(9), 12831291. Goodenough, A. E., & Goodenough, A. S. (January 01, 2012). Development of a Rapid and Precise Method of Digital Image Analysis to Quantify Canopy Density and Structural Complexity. Isrn Ecology, 2012, 3, 111. Korhonen, L., Korhonen, K., Rautiainen, M., & Stenberg, P. (January 01, 2006). Estimation of forest canopy cover: a comparison of field measurement techniques. Silva Fennica,40, 4. Symstad, A. J., Wienk, C. L., & Thorstenson, A. D. (2008). Precision, repeatability, and efficiency of two canopycover estimate methods in northern great plains vegetation. Rangeland Ecology & Management, 61(4), 419429. Zagalikis, G., Cameron, A. D., & Miller, D. R. (2005). The application of digital photogrammetry and image analysis techniques to derive tree and stand characteristics. Canadian Journal of Forest Research, 35(5), 12241237. Densiometer estimate = 17.216 + Photo estimate I would like to thank Aaron Wirsing and Laurel Peelle for their guidance and support. I would also like to thank Laurel for the use of her densiometer data and canopy photographs Pearson’s product moment correlation T=23.3147, p-value<2.2e-16, cor=.8789 The correlation was not equal to zero and the data had strong positive linear relationship Wilcoxon signed rank test W=22708, p-value<2.2e-16 The means for densiometer estimates and photo estimates were not equal Offset Anova Fail to reject that the slope was different than 1 Intercept was different than 0 Source Estimate Intercept Photo estimates 17.216 -0.03984 Offset Anova Standard t value Error 2.498 7.085 0.0412 -0.967 p value 1.89e-11 0.334 Discussion As a result of the linear relationship and the high correlation between the densiometer and photo estimates, it was possible to estimate a conversion equation between the two methods. The equation that best fit the data was Densiometer estimate = 17.216 + Photo estimate. There was no significant difference between the slope and 1, however, there was a significant difference between the intercept and zero. This suggests that the difference between the densiometer estimates and the estimates produced from the photos is relatively constant over the range of canopy cover measured. The need for an intercept different than zero suggests that the photo estimates are underestimating canopy cover when compared to the densiometer. It was expected that the photo estimates would underestimate canopy cover as methods it is correlated with, such as the moosehorn, also produce lower estimates of canopy cover than a densiometer. While there was slight departure from normality, the robust sample of 220 comes from an approximately normal distribution because of the Central Limit Theorem. However, if the sample size was below 50, normality can not have been assumed and the conversion equation may not have been valid. As a result of the large sample size and the other assumptions of a linear relationship met, conversion between the two methods is possible. Thus, canopy photos may replace the densiometer in the field and reduce time spent collecting canopy data. Conversion between methods allows for the photo estimates to be converted to densiometer estimates that are more holistic, less variable and more similar to animal perspectives.


