Mines Web Stats Overview 2009-2015 Compiled by David Frossard
advertisement
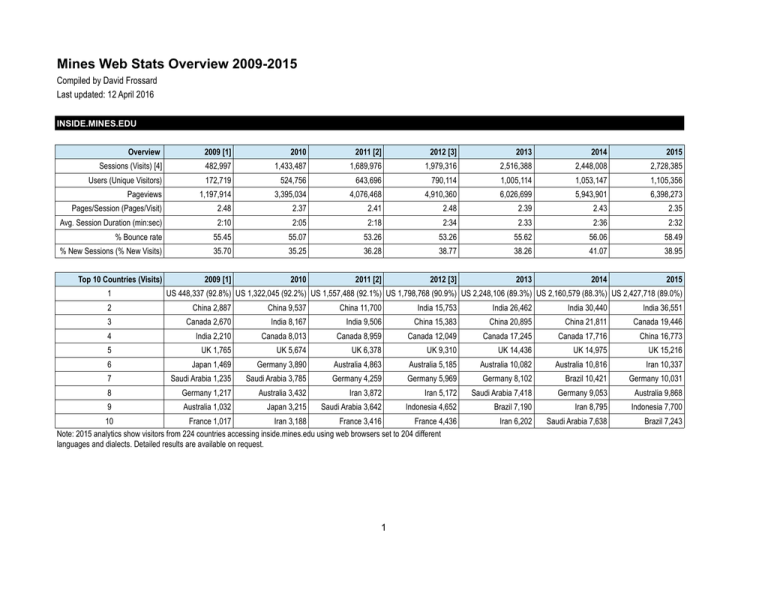
Mines Web Stats Overview 2009-2015 Compiled by David Frossard Last updated: 12 April 2016 INSIDE.MINES.EDU Overview 2009 [1] 2010 2011 [2] 2012 [3] 2013 2014 2015 Sessions (Visits) [4] 482,997 1,433,487 1,689,976 1,979,316 2,516,388 2,448,008 2,728,385 Users (Unique Visitors) 172,719 524,756 643,696 790,114 1,005,114 1,053,147 1,105,356 Pageviews 1,197,914 3,395,034 4,076,468 4,910,360 6,026,699 5,943,901 6,398,273 Pages/Session (Pages/Visit) 2.48 2.37 2.41 2.48 2.39 2.43 2.35 Avg. Session Duration (min:sec) 2:10 2:05 2:18 2:34 2.33 2:36 2:32 % Bounce rate 55.45 55.07 53.26 53.26 55.62 56.06 58.49 % New Sessions (% New Visits) 35.70 35.25 36.28 38.77 38.26 41.07 38.95 Top 10 Countries (Visits) 2009 [1] 2010 2011 [2] 2012 [3] 2013 2014 2015 1 US 448,337 (92.8%) US 1,322,045 (92.2%) US 1,557,488 (92.1%) US 1,798,768 (90.9%) US 2,248,106 (89.3%) US 2,160,579 (88.3%) US 2,427,718 (89.0%) 2 China 2,887 China 9,537 China 11,700 India 15,753 India 26,462 India 30,440 India 36,551 3 Canada 2,670 India 8,167 India 9,506 China 15,383 China 20,895 China 21,811 Canada 19,446 4 India 2,210 Canada 8,013 Canada 8,959 Canada 12,049 Canada 17,245 Canada 17,716 China 16,773 5 UK 1,765 UK 5,674 UK 6,378 UK 9,310 UK 14,436 UK 14,975 UK 15,216 6 Japan 1,469 Germany 3,890 Australia 4,863 Australia 5,185 Australia 10,082 Australia 10,816 Iran 10,337 7 Saudi Arabia 1,235 Saudi Arabia 3,785 Germany 4,259 Germany 5,969 Germany 8,102 Brazil 10,421 Germany 10,031 8 Germany 1,217 Australia 3,432 Iran 3,872 Iran 5,172 Saudi Arabia 7,418 Germany 9,053 Australia 9,868 9 Australia 1,032 Japan 3,215 Saudi Arabia 3,642 Indonesia 4,652 Brazil 7,190 Iran 8,795 Indonesia 7,700 10 France 1,017 Iran 3,188 France 3,416 France 4,436 Note: 2015 analytics show visitors from 224 countries accessing inside.mines.edu using web browsers set to 204 different languages and dialects. Detailed results are available on request. Iran 6,202 Saudi Arabia 7,638 Brazil 7,243 1 OS (%) [7] 2009 [1] 2010 2011 [2] 2012 [3] 2013 2014 2015 Windows 81.4 78.5 74.0 69.4 66.7 64.7 61.7 Mac OS X 15.2 17.4 20.2 20.1 19.7 16.7 16.9 IOS (Mobile) 0.7 1.1 2.3 3.8 8.5 10.8 12.2 Android (Mobile) 0.1 0.4 1.0 2.0 3.6 5.5 6.6 Linux 2.6 2.5 2.1 1.6 1.5 1.4 1.6 Other Or Not Known 0.0 0.1 0.4 3.1 0.1 0.9 1.0 Browser (%) [7] 2009 [1] 2010 2011 [2] 2012 [3] 2013 2014 2015 Chrome 4.3 10.2 17.3 25.6 37.3 45.7 51.1 Safari 12.5 14.5 17.4 20.1 20.5 18.9 19.8 Firefox 30.5 27.1 25.0 21.4 17.1 15.2 13.5 Internet Explorer 51.6 47.2 38.8 29.9 21.3 17.6 13.3 Other Or Not Known 1.1 1.0 1.5 3.0 3.8 2.6 2.3 Mobile [5] 2009 [1] 2010 2011 [2] 2012 [3] 2013 2014 2015 Total Mobile Sessions 2,223 23,251 61,116 152,460 342,504 439,767 555,832 % Of All Sessions 0.5 1.6 3.8 7.7 13.6 18.0 20.4 % Mobile Sessions By Tablets No data No data 1.3 36.0 28.9 25.2 18.0 Mobile OS (%) [7] 2009 [1] 2010 2011 [2] 2012 [3] 2013 2014 2015 iOS 87.4 70.0 67.5 70.1 62.1 60.9 58.7 Android 7.2 24.6 30.0 26.8 33.3 31.5 32.9 Windows/Windows Phone 1.2 0.5 0.1 0.6 1.0 5.7 [6] 7.0 BlackBerry 3.0 3.9 1.7 1.5 0.9 0.6 0.5 Other Or Not Known 1.2 1.0 0.7 1.0 2.7 1.3 0.9 2 WWW.MINES.EDU Overview 2009 2010 2011 2012 2013 2014 2015 Sessions (Visits) [4] 947,796 1,093,314 1,158,629 1,182,584 1,189,814 1,087,449 1,112,861 Users (Unique Visitors) 464,143 543,866 590,477 620,045 648,216 638,319 682,611 Pageviews 3,581,485 3,766,136 3,786,746 3,935,806 3,843,531 3,658,373 3,470,472 Pages/Session (Pages/Visit) 3.78 3.44 3.27 3.33 3.23 3.36 3.12 Avg. Session Duration (min:sec) 2:46 2:33 2:35 2:54 2:42 2:47 2:33 % Bounce rate 42.87 45.93 47.03 45.50 46.43 43.7 46.8 % New Sessions (% New Visits) 48.25 47.58 48.72 50.10 52.12 56.25 59.1 Top 10 Countries (Visits) 2009 2010 2011 2012 2013 2014 2015 1 US 817,348 (86.2%) US 944,975 (86.4%) US 988,937 (85.4%) US 997,435 (84.3%) US 985,236 (82.8%) US 892,479 (82.1%) US 925,943 (83.2%) 2 China 17,392 China 18,119 China 24,461 China 25,780 China 26,103 India 23,034 India 23,817 3 India 9,338 India 11,258 India 12,890 India 15,302 India 20,269 China 21,023 China 15,806 4 Canada 9,007 Canada 10,867 Canada 10,092 Canada 10,646 Canada 10,970 Canada 9,857 Canada 9,700 5 UK 6,472 UK 7,464 UK 7,585 UK 7,642 Saudi Arabia 8,331 Saudi Arabia 8,202 UK 7,222 6 Saudi Arabia 5,607 Saudi Arabia 6,762 Saudi Arabia 6,499 Saudi Arabia 7,266 UK 8,047 Brazil 7,366 Iran 6,297 7 Iran 4,461 Iran 5,637 Iran 6,296 Iran 6,527 Iran 6,478 UK 7,075 Saudi Arabia 6,160 8 Nigeria 3,601 Nigeria 4,100 Nigeria 5,087 Nigeria 4,898 Brazil 6,160 Iran 6,678 Indonesia 5,755 9 Germany 3,410 Germany 4,040 Australia 4,071 Australia 4,839 Malaysia 5,228 Indonesia 5,336 Brazil 5,439 10 S. Korea 3,395 Turkey 3,547 Turkey 3,904 Indonesia 4,738 Note: 2015 analytics show visitors from 219 countries accessing www.mines.edu using web browsers set to 183 different languages and dialects. Detailed results are available on request. Australia 4,961 Malaysia 5,298 Malaysia 4,691 OS (%) [7] 2009 2010 2011 2012 2013 2014 2015 Windows 83.7 78.2 72.6 67.2 62.4 59.6 55.9 IOS (Mobile) 0.9 1.6 3.9 8.0 12.0 15.8 17.6 Mac OS X 13.9 18.2 20.3 20.5 19.8 16.0 16.2 Android (Mobile) 0.1 0.5 1.5 2.5 4.0 6.6 7.7 Linux 1.1 1.1 1.0 0.9 0.8 0.8 0.7 Other Or Not Known 0.3 0.4 0.7 0.9 1.0 1.0 1.9 3 Browser (%) [7] 2009 2010 2011 2012 2013 2014 2015 Chrome 3.2 8.7 14.9 22.8 32.5 40.5 49.2 Safari 11.7 16.5 20.6 22.9 24.5 23.8 24.4 Internet Explorer 56.2 48.4 40.4 32.5 23.8 19.3 13.4 Firefox 27.9 25.3 22.3 17.9 14.6 13.0 10.2 Other Or Not Known 1.0 1.1 1.8 3.9 4.6 3.4 2.8 Mobile [5] 2009 2010 2011 2012 2013 2014 2015 Total Mobile Sessions 3,895 25,703 66,578 131,391 205,877 262,572 301,288 % Of All Sessions 0.4 2.4 6.1 11.1 17.3 24.2 27.1 % Mobile Sessions By Tablets No data No data 4.0 36.8 35.7 31.7 23.6 Mobile OS (%) [7] 2009 2010 2011 2012 2013 2014 2015 iOS 79.9 68.4 69.1 72.4 73.1 67.6 65.4 Android 7.3 22.4 27.2 23.4 23.8 27.0 28.4 Windows/Windows Phone 2.0 0.9 0.2 0.5 0.9 4.0 5.3 BlackBerry 8.2 7.0 2.8 2.0 0.9 0.6 0.4 Other Or Not Known 2.6 1.3 0.7 1.7 1.3 0.8 0.5 4 Notes [1] We began to gather analytics data for inside.mines.edu in early July 2009, so data for that calendar year are incomplete. For a rough whole-year estimate, simply double the number of visits reported above. (The 2009 figures for www.mines.edu are complete and correct.) [2] Due to a short period with missing data, correct inside.mines.edu numbers for visits in 2011 should be an estimated 9 percent higher than these raw figures. [3] Due to a short period with missing data, correct inside.mines.edu numbers for visits in 2012 should be an estimated 4 percent higher than these raw figures. [4] In 2015, Google changed some of its analytics terminology. Older terms are noted in parentheses. [5] Mobile figures have today been revised (generally slightly upward) since earlier estimates, based on the availability of improved analytics data. The figures shown above supersede previous numbers. [6] In 2014, Google Analytics began to specify Windows and Windows Phone separately as phone operating systems. Prior to that time only the Windows Phone category was reported. The relatively large increase in the general Windows categories in 2014 may be an artifact of the new reporting system. [7] Lists are generally sorted by 2015 figures (where appropriate) to reflect current popularity of particular operating systems, browsers, and so on. GLOSSARY Bounce Rate The % of single-page visits (i.e., visitor left original page without further interaction). New Session An estimate of the % of first-time users initiating a session. Session A discrete instance in which a user is actively engaged with a website. Pages/Session Number of web pages viewed in a single session. Pageviews Total number of pages viewed, including repeat visits within a single session. Session Duration Time in which a user is engaged with a website. Users Individuals who have had at least one session on a website, including new and returning use 5
