Document 13421179
advertisement
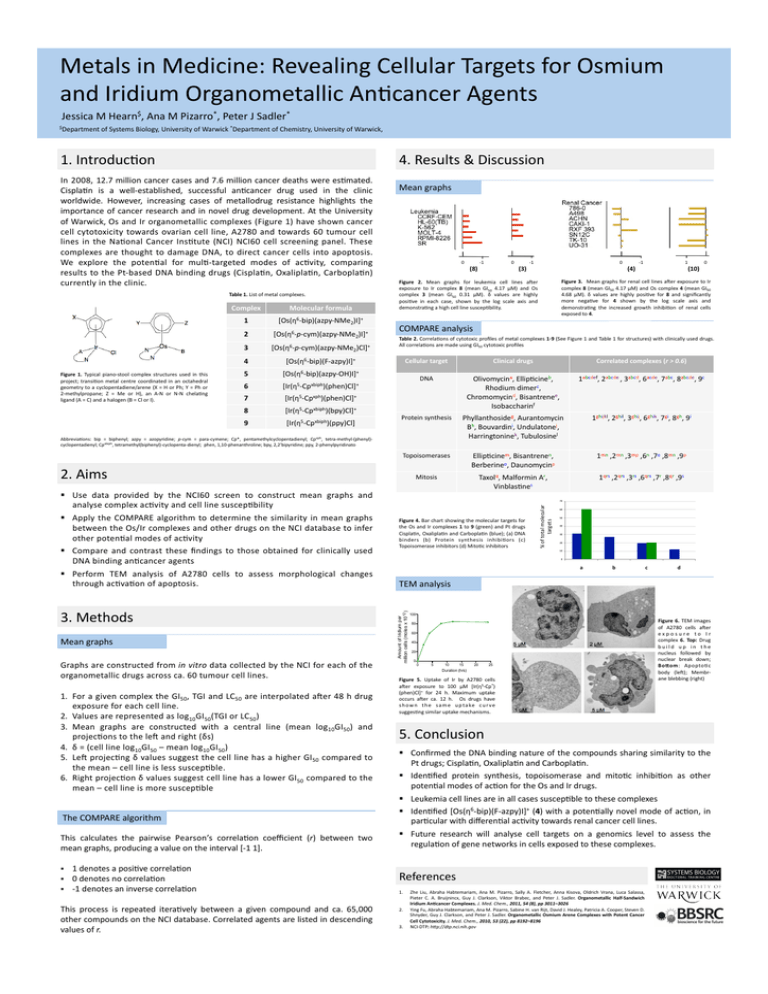
Metals in Medicine: Revealing Cellular Targets for Osmium and Iridium Organometallic An:cancer Agents Jessica M Hearn$, Ana M Pizarro*, Peter J Sadler* $Department of Systems Biology, University of Warwick *Department of Chemistry, University of Warwick, 4. Results & Discussion In 2008, 12.7 million cancer cases and 7.6 million cancer deaths were es:mated. Cispla:n is a well-­‐established, successful an:cancer drug used in the clinic worldwide. However, increasing cases of metallodrug resistance highlights the importance of cancer research and in novel drug development. At the University of Warwick, Os and Ir organometallic complexes (Figure 1) have shown cancer cell cytotoxicity towards ovarian cell line, A2780 and towards 60 tumour cell lines in the Na:onal Cancer Ins:tute (NCI) NCI60 cell screening panel. These complexes are thought to damage DNA, to direct cancer cells into apoptosis. We explore the poten:al for mul:-­‐targeted modes of ac:vity, comparing results to the Pt-­‐based DNA binding drugs (Cispla:n, Oxalipla:n, Carbopla:n) currently in the clinic. Table 1. List of metal complexes. Figure 1. Typical piano-­‐stool complex structures used in this project; transi:on metal centre coordinated in an octahedral geometry to a cyclopentadiene/arene (X = H or Ph; Y = Ph or 2-­‐methylpropane; Z = Me or H), an A-­‐N or N-­‐N chela:ng ligand (A = C) and a halogen (B = Cl or I). Complex Molecular formula 1 [Os(η6-­‐bip)(azpy-­‐NMe2)I]+ 2 [Os(η6-­‐p-­‐cym)(azpy-­‐NMe2)I]+ 3 [Os(η6-­‐p-­‐cym)(azpy-­‐NMe2)Cl]+ 4 [Os(η6-­‐bip)(F-­‐azpy)I]+ 5 [Os(η6-­‐bip)(azpy-­‐OH)I]+ 6 [Ir(η5-­‐Cpxbiph)(phen)Cl]+ 7 [Ir(η5-­‐Cpxph)(phen)Cl]+ 8 [Ir(η5-­‐Cpxbiph)(bpy)Cl]+ 9 [Ir(η5-­‐Cpxbiph)(ppy)Cl] Mean graphs 0 -­‐1 Mean graphs Graphs are constructed from in vitro data collected by the NCI for each of the organometallic drugs across ca. 60 tumour cell lines. 1. For a given complex the GI50, TGI and LC50 are interpolated aqer 48 h drug exposure for each cell line. 2. Values are represented as log10GI50(TGI or LC50) 3. Mean graphs are constructed with a central line (mean log10GI50) and projec:ons to the leq and right (δs) 4. δ = (cell line log10GI50 – mean log10GI50) 5. Leq projec:ng δ values suggest the cell line has a higher GI50 compared to the mean – cell line is less suscep:ble. 6. Right projec:on δ values suggest cell line has a lower GI50 compared to the mean – cell line is more suscep:ble (10) Figure 3. Mean graphs for renal cell lines aqer exposure to Ir complex 8 (mean GI50 4.17 μM) and Os complex 4 (mean GI50 4.68 μM). δ values are highly posi:ve for 8 and significantly more nega:ve for 4 shown by the log scale axis and demonstra:ng the increased growth inhibi:on of renal cells exposed to 4. Table 2. Correla:ons of cytotoxic profiles of metal complexes 1-­‐9 (See Figure 1 and Table 1 for structures) with clinically used drugs. All correla:ons are made using GI50 cytotoxic profiles Cellular target Clinical drugs Correlated complexes (r > 0.6) DNA Olivomycina, Ellip:cineb, Rhodium dimerc, Chromomycind, Bisantrenee, Isobaccharinf 1abcdef, 2abcde , 3abcd, 6acde, 7abc, 8abcde, 9c Protein synthesis Phyllanthosideg, Aurantomycin Bh, Bouvardini, Undulatonej, Harringtoninek, Tubulosinel 1ghijkl, 2ghil, 3ghij, 6ghik, 7gi, 8gh, 9i Topoisomerases Ellip:cinem, Bisantrenen, Berberineo, Daunomycinp 1mn ,2mn ,3mp ,6n ,7o ,8mn ,9p Mitosis Taxolq, Malformin Ar, Vinblas:nes 1qrs ,2qrs ,3rs ,6qrs ,7r ,8qr ,9s 70 Figure 4. Bar chart showing the molecular targets for the Os and Ir complexes 1 to 9 (green) and Pt drugs Cispla:n, Oxalipla:n and Carbopla:n (blue); (a) DNA binders (b) Protein synthesis inhibi:ors (c) Topoisomerase inhibitors (d) Mito:c inhibitors 60 50 40 30 20 10 0 a b c d TEM analysis Amount of Iridium per million cells (moles x 1012) 3. Methods 1 0 (4) COMPARE analysis 2. Aims Perform TEM analysis of A2780 cells to assess morphological changes through ac:va:on of apoptosis. 0 -­‐1 (3) Figure 2. Mean graphs for leukemia cell lines aqer exposure to Ir complex 8 (mean GI50 4.17 μM) and Os complex 3 (mean GI50 0.31 μM). δ values are highly posi:ve in each case, shown by the log scale axis and demonstra:ng a high cell line suscep:bility. Abbrevia:ons: bip = biphenyl; azpy = azopyridine; p-­‐cym = para-­‐cymene; Cp*, pentamethylcyclopentadienyl; Cpxph, tetra-­‐methyl-­‐(phenyl)-­‐ cyclopentadienyl; Cpxbiph, tetramethyl(biphenyl)-­‐cyclopenta-­‐dienyl; phen, 1,10-­‐phenanthroline; bpy, 2,2’bipyridine; ppy, 2-­‐phenylpyridinato Use data provided by the NCI60 screen to construct mean graphs and analyse complex ac:vity and cell line suscep:bility Apply the COMPARE algorithm to determine the similarity in mean graphs between the Os/Ir complexes and other drugs on the NCI database to infer other poten:al modes of ac:vity Compare and contrast these findings to those obtained for clinically used DNA binding an:cancer agents 0 -­‐1 (8) % of total molecular targets 1. Introduc:on 100 80 60 40 20 0 0 5 10 15 20 25 Duration (hrs) Figure 5. Uptake of Ir by A2780 cells aqer exposure to 100 μM [Ir(η5-­‐Cp*) (phen)Cl]+ for 24 h. Maximum uptake occurs aqer ca. 12 h. Os drugs have s h o w n t h e s a m e u p t a ke c u r v e sugges:ng similar uptake mechanisms. Figure 6. TEM images of A2780 cells aqer e x p o s u r e t o I r complex 6. Top: Drug b u i l d u p i n t h e nucleus followed by nuclear break down; BoQom: Apopto:c body (leq); Membr-­‐ ane blebbing (right) 5. Conclusion Confirmed the DNA binding nature of the compounds sharing similarity to the Pt drugs; Cispla:n, Oxalipla:n and Carbopla:n. Iden:fied protein synthesis, topoisomerase and mito:c inhibi:on as other poten:al modes of ac:on for the Os and Ir drugs. The C OMPARE algorithm Leukemia cell lines are in all cases suscep:ble to these complexes Iden:fied [Os(η6-­‐bip)(F-­‐azpy)I]+ (4) with a poten:ally novel mode of ac:on, in par:cular with differen:al ac:vity towards renal cancer cell lines. This calculates the pairwise Pearson’s correla:on coefficient (r) between two mean graphs, producing a value on the interval [-­‐1 1]. Future research will analyse cell targets on a genomics level to assess the regula:on of gene networks in cells exposed to these complexes. 1 denotes a posi:ve correla:on 0 denotes no correla:on -­‐1 denotes an inverse correla:on This process is repeated itera:vely between a given compound and ca. 65,000 other compounds on the NCI database. Correlated agents are listed in descending values of r. References 1. 2. 3. Zhe Liu, Abraha Habtemariam, Ana M. Pizarro, Sally A. Fletcher, Anna Kisova, Oldrich Vrana, Luca Salassa, Pieter C. A. Bruijnincx, Guy J. Clarkson, Viktor Brabec, and Peter J. Sadler. Organometallic Half-­‐Sandwich Iridium AnEcancer Complexes. J. Med. Chem., 2011, 54 (8), pp 3011–3026 Ying Fu, Abraha Habtemariam, Ana M. Pizarro, Sabine H. van Rijt, David J. Healey, Patricia A. Cooper, Steven D. Shnyder, Guy J. Clarkson, and Peter J. Sadler. Organometallic Osmium Arene Complexes with Potent Cancer Cell Cytotoxicity. J. Med. Chem., 2010, 53 (22), pp 8192–8196 NCI-­‐DTP: h.p://dtp.nci.nih.gov
