Solar Flares.
advertisement

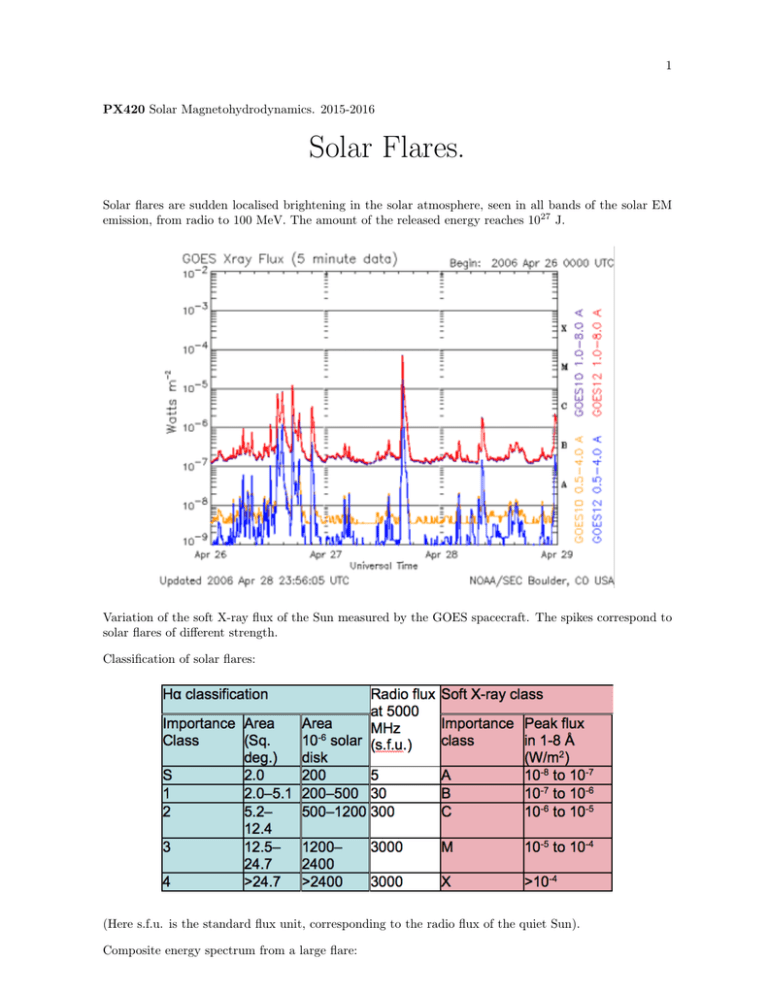
1 PX420 Solar Magnetohydrodynamics. 2015-2016 Solar Flares. Solar flares are sudden localised brightening in the solar atmosphere, seen in all bands of the solar EM emission, from radio to 100 MeV. The amount of the released energy reaches 1027 J. Variation of the soft X-ray flux of the Sun measured by the GOES spacecraft. The spikes correspond to solar flares of different strength. Classification of solar flares: (Here s.f.u. is the standard flux unit, corresponding to the radio flux of the quiet Sun). Composite energy spectrum from a large flare: 2 (1 eV ≈ 11,600 K ≈ 1.60 × 10¹⁹ J) And its interpretation: There is a relation between the soft X-ray flux (thermal emission) and hard X-ray and microwave fluxes (non-thermal emission): the Neupert effect. The Neupert effect simply notes that the hard X-rays occur during the rise phase of the soft X-rays. 3 The time derivative of the soft X-ray light curve resembles the hard X-ray light curve. As the microwave emission has the time dependence very similar to the X-ray light curve, the Neupert effect is seen for the time dependence of the soft X-ray and microwave light curves too. The standard model of solar flare: 4 1. Magnetic free energy is stored in the corona, due to either motions of the photospheric footpoints of loops or to the emergence of current-carrying field from below the photosphere. 2. A cool, dense filament forms, suspended by the magnetic field, over the neutral line. 3. The field evolves slowly through equilibrium states, finally reaching a non-equilibrium which causes the closed field to rise and erupts outward. 4. The reconnection of the field below the rising filament provides plasma heating and particle acceleration that we call the flare. 5. The accelerated particles follow the field lines and interact with the chromosphere, heating it and causing the evaporation upflows of the plasma. 6. “Post-flare loops” are formed over the neutral line; they gradually cool down by radiation. 7. More field lines are involved in reconnection; the reconnection site is going up, forming new postflare loops situated above the previously created ones. 8. A multi-temperature arcade is formed with “older” cooler loops being below “new” hotter loops. 5 An observational detection of the cusp-like structure predicted by the standard solar flare model in soft X-rays: Emission associated with non-thermal electrons produced in the reconnection site: 6 Spatial structure of the sources of soft X-ray (red contours) and hard X-ray (green contours) emission. The flaring loop (under the reconnection site) is seen in the soft X-rays, while the footpoints of this loop as seen in hard X-rays: Example of a two-ribbon flare. There the red colour shows the UV continuum, highlighting the footpoints of the arcade loops — the “ribbons”: 7 There are other possible scenarios of solar flares, e.g.: Statistics of solar flares 8 Scaling of the solar flare frequencies with different parameters of the flaring regions: (Here the emission measure EM is the product of the electron concentration squared and the volume of the flaring site, so its dimension is m−3 .) We see the power law distribution: the flare frequency f against its energy E: f (E) ∝ E −a . 9 The total heating rate released by all flares can be calculated by summing up the products of the flare frequencies f (E) and energies over the range of possible energies: Z Emax f (E)EdE, Wtot = Emin where f (E) = f0 (E/E0 )−a , and f0 and E0 are constant. Typically Emax = 1032 erg, and Emin = 1024 erg (so-called “nano-flares”, while this value is still debated). Evaluating the integral, obtain Wtot f0 E02 = 2−a " Emax E0 2−a − Emin E0 2−a # . If a < 2, the bulk of heating is delivered by large events. If a > 2, the bulk of heating is delivered by small events. To compensate the energy losses by radiation and thermal conduction, the corona must be heated at the rate • Active regions: Wtot ≈ 107 erg s−1 cm−2 , • Quiet corona: Wtot ≈ 3 × 10⁵ erg s−1 cm−2 . Observational estimations of the power law index a: The detected radiation of the EUV and SXT nanoflares roughly corresponds to a third of the total coronal heating requirement. Hence the coronal heating problem remains unsolved. Variation of the emitted X-ray flux with solar cycle: 10 Correlation of emitted X-ray flux with sunspot numbers: Super- and megaflares on stars: 11


