2005 - 2006 Teen Birth Statistics for Mecklenburg County
advertisement
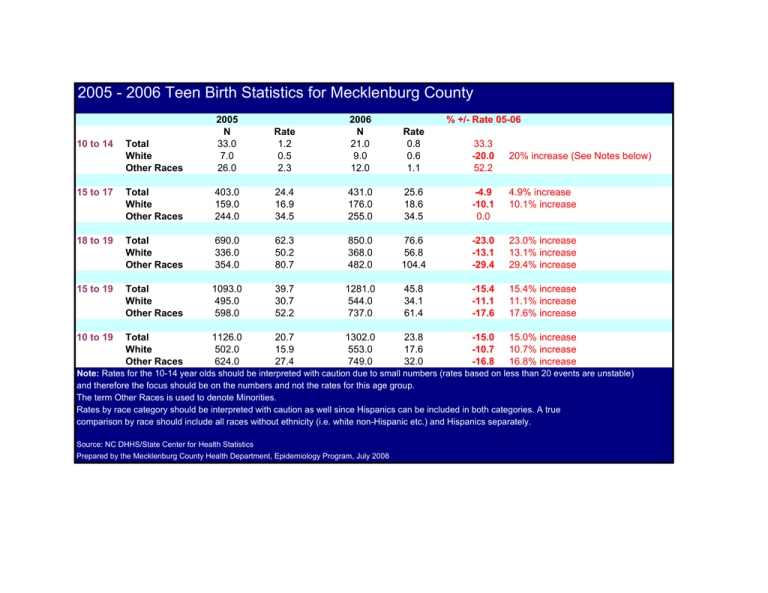
2005 - 2006 Teen Birth Statistics for Mecklenburg County Total White Other Races 2005 N 33.0 7.0 26.0 Rate 1.2 0.5 2.3 2006 N 21.0 9.0 12.0 Rate 0.8 0.6 1.1 33.3 -20.0 52.2 15 to 17 Total White Other Races 403.0 159.0 244.0 24.4 16.9 34.5 431.0 176.0 255.0 25.6 18.6 34.5 -4.9 -10.1 0.0 4.9% increase 10.1% increase 18 to 19 Total White Other Races 690.0 336.0 354.0 62.3 50.2 80.7 850.0 368.0 482.0 76.6 56.8 104.4 -23.0 -13.1 -29.4 23.0% increase 13.1% increase 29.4% increase 15 to 19 Total White Other Races 1093.0 495.0 598.0 39.7 30.7 52.2 1281.0 544.0 737.0 45.8 34.1 61.4 -15.4 -11.1 -17.6 15.4% increase 11.1% increase 17.6% increase 10 to 19 Total White Other Races 1126.0 502.0 624.0 20.7 15.9 27.4 1302.0 553.0 749.0 23.8 17.6 32.0 -15.0 -10.7 -16.8 15.0% increase 10.7% increase 16.8% increase 10 to 14 % +/- Rate 05-06 20% increase (See Notes below) Note: Rates for the 10-14 year olds should be interpreted with caution due to small numbers (rates based on less than 20 events are unstable) and therefore the focus should be on the numbers and not the rates for this age group. The term Other Races is used to denote Minorities. Rates by race category should be interpreted with caution as well since Hispanics can be included in both categories. A true comparison by race should include all races without ethnicity (i.e. white non-Hispanic etc.) and Hispanics separately. Source: NC DHHS/State Center for Health Statistics Prepared by the Mecklenburg County Health Department, Epidemiology Program, July 2008
