Communication Support for NASA Enterprises: Probability-based SAP
advertisement

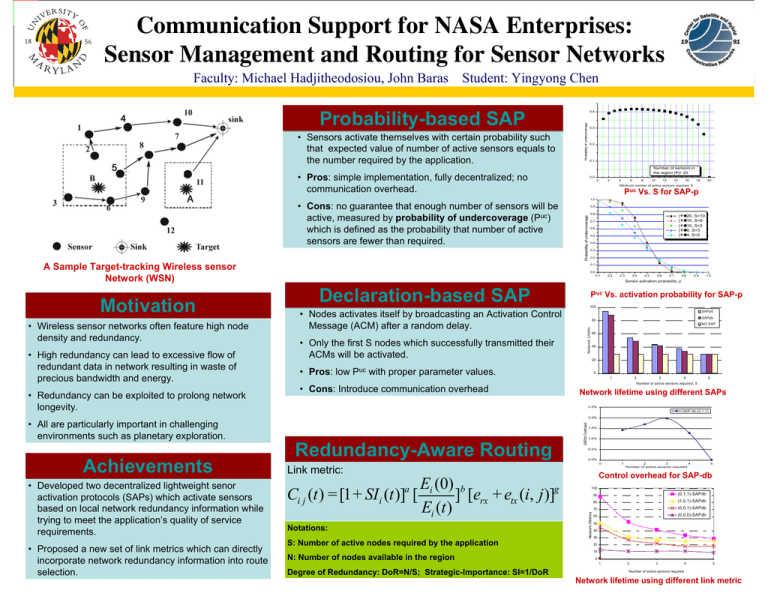
Communication Support for NASA Enterprises: Sensor Management and Routing for Sensor Networks Faculty: Michael Hadjitheodosiou, John Baras Student: Yingyong Chen • Sensors activate themselves with certain probability such that expected value of number of active sensors equals to the number required by the application. 0.4 Probability of undercoverage Probability-based SAP 0.3 0.2 0.1 Number of sensors in the region |>|= 20 • Pros: simple implementation, fully decentralized; no communication overhead. 0.0 0 2 4 6 8 10 12 14 16 18 20 Minimum number of active sensors required, S Puc Vs. S for SAP-p 1.0 Probability of undercoverage • Cons: no guarantee that enough number of sensors will be active, measured by probability of undercoverage (Puc) which is defined as the probability that number of active sensors are fewer than required. 0.9 A Sample Target-tracking Wireless sensor Network (WSN) • Wireless sensor networks often feature high node density and redundancy. • High redundancy can lead to excessive flow of redundant data in network resulting in waste of precious bandwidth and energy. • Redundancy can be exploited to prolong network longevity. |>V =20, S=10 |>V =16, S=8 |>V =10, S=5 |>V =6, S=3 |>V =4, S=2 0.7 0.6 0.5 0.4 0.3 0.2 0.1 0.0 0.1 0.2 0.3 0.4 0.5 0.6 0.7 0.8 0.9 1.0 Sensor activation probability, p Declaration-based SAP Puc Vs. activation probability for SAP-p 100 SAPp0 • Nodes activates itself by broadcasting an Activation Control Message (ACM) after a random delay. NO SAP • Only the first S nodes which successfully transmitted their ACMs will be activated. 60 40 20 • Pros: low Puc with proper parameter values. • Cons: Introduce communication overhead SAPdb 80 Network Lifetim Motivation 0.8 0 1 2 3 4 5 Number of active sensors required, S Network lifetime using different SAPs 2.5% SAP-db (0,1,1) • All are particularly important in challenging environments such as planetary exploration. • Developed two decentralized lightweight senor activation protocols (SAPs) which activate sensors based on local network redundancy information while trying to meet the application’s quality of service requirements. • Proposed a new set of link metrics which can directly incorporate network redundancy information into route selection. 1.5% 1.0% 0.5% 0.0% 0 Link metric: E (0) Ci j (t ) = [1 + SIi (t )]a [ i ]b [erx + etx (i, j )]g Ei (t ) Notations: S: Number of active nodes required by the application 1 2 3 4 Number of active sensors required 5 Control overhead for SAP-db 100 Network lifetime Achievements Redundancy-Aware Routing SAPdb Overhead 2.0% 90 (0,1,1)-SAPdb 80 (1,0,1)-SAPdb 70 (0,0,1)-SAPdb 60 (0,0,0)-SAPdb 50 40 30 20 10 N: Number of nodes available in the region 0 1 Degree of Redundancy: DoR=N/S; Strategic-Importance: SI=1/DoR 2 3 4 5 Number of active sensors required Network lifetime using different link metric


