Proceedings of Global Business Research Conference
advertisement
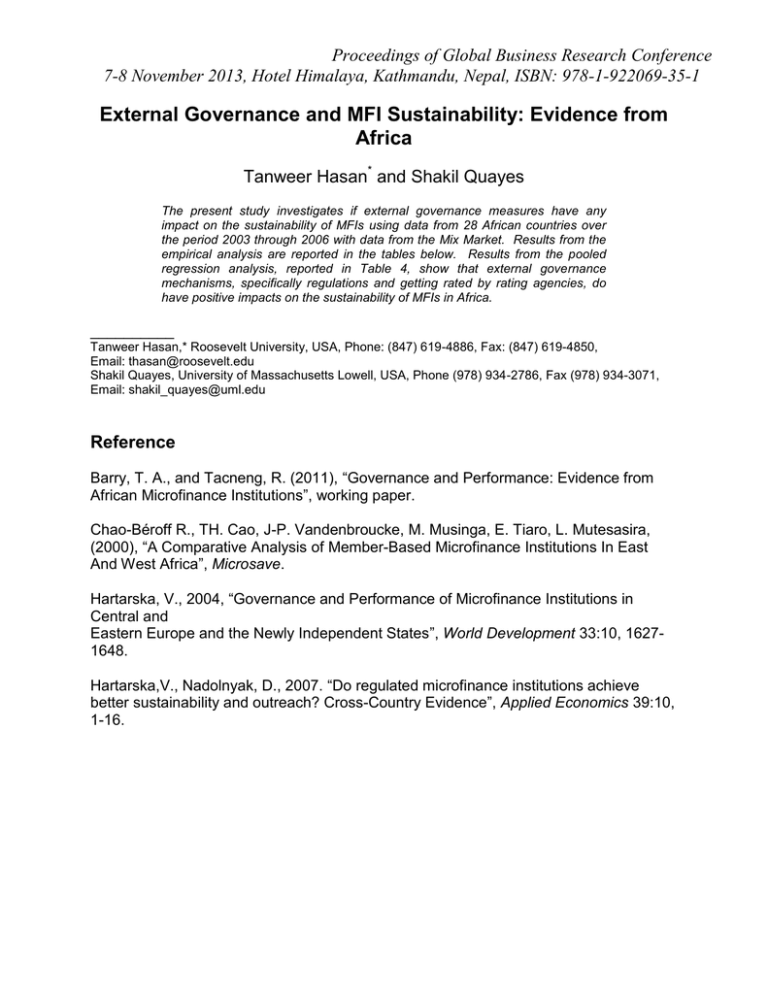
Proceedings of Global Business Research Conference 7-8 November 2013, Hotel Himalaya, Kathmandu, Nepal, ISBN: 978-1-922069-35-1 External Governance and MFI Sustainability: Evidence from Africa Tanweer Hasan* and Shakil Quayes The present study investigates if external governance measures have any impact on the sustainability of MFIs using data from 28 African countries over the period 2003 through 2006 with data from the Mix Market. Results from the empirical analysis are reported in the tables below. Results from the pooled regression analysis, reported in Table 4, show that external governance mechanisms, specifically regulations and getting rated by rating agencies, do have positive impacts on the sustainability of MFIs in Africa. __________ Tanweer Hasan,* Roosevelt University, USA, Phone: (847) 619-4886, Fax: (847) 619-4850, Email: thasan@roosevelt.edu Shakil Quayes, University of Massachusetts Lowell, USA, Phone (978) 934-2786, Fax (978) 934-3071, Email: shakil_quayes@uml.edu Reference Barry, T. A., and Tacneng, R. (2011), “Governance and Performance: Evidence from African Microfinance Institutions”, working paper. Chao-Béroff R., TH. Cao, J-P. Vandenbroucke, M. Musinga, E. Tiaro, L. Mutesasira, (2000), “A Comparative Analysis of Member-Based Microfinance Institutions In East And West Africa”, Microsave. Hartarska, V., 2004, “Governance and Performance of Microfinance Institutions in Central and Eastern Europe and the Newly Independent States”, World Development 33:10, 16271648. Hartarska,V., Nadolnyak, D., 2007. “Do regulated microfinance institutions achieve better sustainability and outreach? Cross-Country Evidence”, Applied Economics 39:10, 1-16. Proceedings of Global Business Research Conference 7-8 November 2013, Hotel Himalaya, Kathmandu, Nepal, ISBN: 978-1-922069-35-1 Table 1: List of Countries in the Sample (Total Sample Size = 427) SL # 1 2 3 4 5 6 7 8 9 10 11 12 13 14 Name of the Country Angola Benin Burkina Faso Burundi Cameroon Chad Congo Congo, D R Cote D’Ivoire Ethiopia Ghana Guinea Kenya Madagascar N 2 29 8 2 18 7 6 14 2 55 10 1 30 17 SL # 15 16 17 18 19 20 21 22 23 24 25 26 27 28 Name of the Country Malawi Mali Mozambique Niger Nigeria Rwanda Senegal Sierra Leone South Africa Swaziland Tanzania Togo Uganda Zambia N 11 30 24 8 14 8 31 7 183 4 21 17 32 12 Table 2: Descriptive Statistics Variable N Mean Sustainability Rated Regulated Age Size Risk 427 427 412 427 427 360 1.08 0.31 0.76 8.99 13.04 0.09 Standard Deviation 0.39 0.46 0.43 5.95 28.22 0.11 Minimum Maximum 0.13 0.00 0.00 1.00 0.04 0.00 2.98 1.00 1.00 37.00 287.50 0.94 Notes: (1) Sustainability (Operational Self Sufficiency, OSS): calculated as OSS = [(Operating Income) / (Financial Expense + Loan-Loss Expense + Operating Expense)] (2) Rated: dummy variable, assigned a value of 1 if rating agency has rated the MFI, 0 otherwise (3) Regulated: dummy variable, assigned a value of 1 if the MFI is regulated, 0 otherwise (4) Age: In years and calculated as Age = (Current Year – Year of Establishment of the MFI) (5) Size: Total assets of the MFI in millions, in US $ Proceedings of Global Business Research Conference 7-8 November 2013, Hotel Himalaya, Kathmandu, Nepal, ISBN: 978-1-922069-35-1 Table 3: Correlation Matrix for the Explanatory Variables Variable Rated Regulated Age Size Risk Rated 1.00 -0.08 0.12** 0.27* -0.17* Regulated Age Size Risk 1.00 -0.02 0.10** 0.01 1.00 0.42* 0.01 1.00 -0.11** 1.00 Notes: (1) Size = log of total assets of the MFI * (2) indicates that the correlation coefficient is significant at 1% level. ** (3) indicates that the correlation coefficient is significant at 5% level. Table 4: Regression Analysis (N = 346) Sustainabilityi = α + β1 Ratedi + β2 Regulatedi + β3 Agei + β4 Sizei + β5 Riski + εi Variable Constant Coefficient 0.05 Rated 0.08 Regulated 0.10 Age 0.00 Size 0.06 Risk -0.27 F-statistic VIF Range 10.46 (0.00)* 1.03 – 1.39 Adjusted R2 12.06% t-statistic 0.27 (0.79) 1.84 (0.07)*** 2.12 (0.04)** 0.09 (0.93) 4.61 (0.00)* -1.53 (0.13) Notes: (4) Size = log of total assets of the MFI * (5) indicates that the correlation coefficient is significant at 1% level. ** (6) indicates that the correlation coefficient is significant at 5% level.

