Document 13308811
Int. J. Pharm. Sci. Rev. Res., 15(1), 2012; n ᵒ 08, 36-40 ISSN 0976 – 044X
Research Article
SIMULTANEOUS SPECTROPHOTOMETRIC ESTIMATION OF
METAXALONE AND DICLOFENAC POTASSIUM FROM TABLET DOSAGE FORM
Prachi Kabra*
1
, Chintan Patel
1
, Ritu Kimbahune
2
, Neha Raj
1
, LVG Nargund
1
1. Department of Quality Assurance, Nargund College of Pharmacy, Dattatreyanagar, Bangalore, India.
2. Department of Quality Assurance, Al-Ameen College of Pharmacy, Hosur Road, Lal Bagh Main Road, Bangalore, India.
Accepted on: 10-05-2012; Finalized on: 30-06-2012.
ABSTRACT
In the present research work, absorbance correction method and first order derivative spectrophotometric method have been developed for the simultaneous estimation of Metaxalone and Diclofenac potassium in tablet dosage form. Methanol was used as a solvent in both the methods. The wavelengths of absorption of Metaxalone and Diclofenac potassium were found to be 279 nm and
300 nm respectively and absorbencies at theses wavelengths were used for absorption correction method, while in the first order derivative spectrophotometric method, amplitudes were measured at 302.42nm for Metaxalone (zero cross for Diclofenac potassium) and 282.08 nm for Diclofenac potassium (zero cross for Metaxalone). Metaxalone was found to be linear in the concentration range of 20 to 180µg/ml at 279nm while Diclofenac potassium was found to be linear in the concentration range 5 to
35µg/ml at 300nm and 3 to 24 µg/ml at 279nm.
The marketed formulation was analysed using these methods and the results were obtained in the range of 98.26% to 100.97% for Metaxalone and 98.43.39% to 101.49% for Diclofenac potassium, which was found satisfactory. These methods allow rapid analysis of binary pharmaceutical formulation of Metaxalone and Diclofenac potassium with accuracy.
Keywords: Metaxalone and Diclofenac Potassium, Absorption Correction Method, First Order Derivative Spectrophotometric
Method.
INTRODUCTION
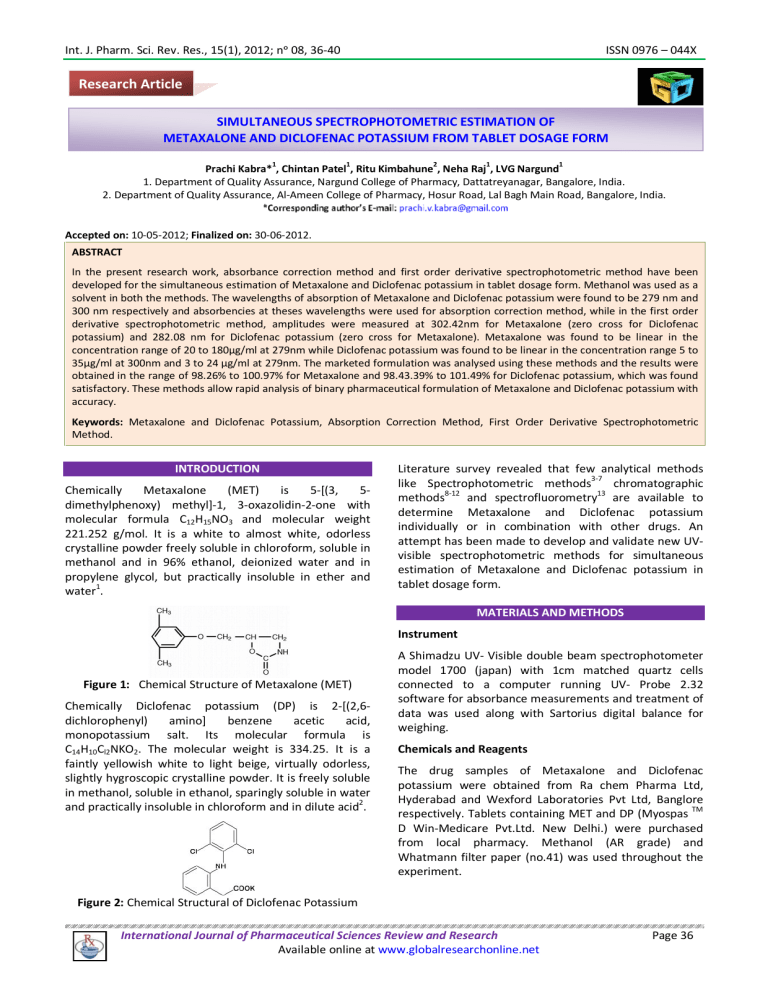
Chemically Metaxalone (MET) is 5-[(3, 5dimethylphenoxy) methyl]-1, 3-oxazolidin-2-one with molecular formula C
12
H
15
NO
3 and molecular weight
221.252 g/mol. It is a white to almost white, odorless crystalline powder freely soluble in chloroform, soluble in methanol and in 96% ethanol, deionized water and in propylene glycol, but practically insoluble in ether and water
1
.
Literature survey revealed that few analytical methods like Spectrophotometric methods methods
8-12
3-7 and spectrofluorometry
chromatographic
13 are available to determine Metaxalone and Diclofenac potassium individually or in combination with other drugs. An attempt has been made to develop and validate new UVvisible spectrophotometric methods for simultaneous estimation of Metaxalone and Diclofenac potassium in tablet dosage form.
MATERIALS AND METHODS
Figure 1: Chemical Structure of Metaxalone (MET)
Chemically Diclofenac potassium (DP) is 2-[(2,6dichlorophenyl) amino] benzene acetic acid, monopotassium salt. Its molecular formula is
C
14
H
10
C l2
NKO
2
. The molecular weight is 334.25. It is a faintly yellowish white to light beige, virtually odorless, slightly hygroscopic crystalline powder. It is freely soluble in methanol, soluble in ethanol, sparingly soluble in water and practically insoluble in chloroform and in dilute acid
Figure 2: Chemical Structural of Diclofenac Potassium
2
.
Instrument
A Shimadzu UV- Visible double beam spectrophotometer model 1700 (japan) with 1cm matched quartz cells connected to a computer running UV- Probe 2.32 software for absorbance measurements and treatment of data was used along with Sartorius digital balance for weighing.
Chemicals and Reagents
The drug samples of Metaxalone and Diclofenac potassium were obtained from Ra chem Pharma Ltd,
Hyderabad and Wexford Laboratories Pvt Ltd, Banglore respectively. Tablets containing MET and DP (Myospas
TM
D Win-Medicare Pvt.Ltd. New Delhi.) were purchased from local pharmacy. Methanol (AR grade) and
Whatmann filter paper (no.41) was used throughout the experiment.
International Journal of Pharmaceutical Sciences Review and Research Page 36
Available online at www.globalresearchonline.net
Int. J. Pharm. Sci. Rev. Res., 15(1), 2012; n ᵒ 08, 36-40 ISSN 0976 – 044X
Preparation of Standard Solution
The stock solution (1000µg/ml) of MET and DP were prepared separately by dissolving accurately weighed
50mg of drug in 50ml of methanol.
Determination of Wavelength of Absorbance Maxima
The above stock solution was further diluted with methanol to get concentration of 120µg/ml for MET and
15µg/ml for DP. These solutions were scanned in the range 200-400nm against methanol as a blank. The absorbance maxima of MET and DP were found to be at
279nm and 282nm.
Figure 6: Calibration Curve of DP at 279 nm
The stock solution of drugs were appropriately diluted to obtain concentration range of 20 to 180µg/ml for MET and 5 to 40 µg/ml for DP. The absorption of the solution were measured at 282.08nm for MET and 302.40nm for
DP for first order derivatives. The Calibration curves of
MET and DP were plotted and are showing in fig. 7,8,9.
λmax for Metaxalone (MET) and Diclofenac pot assium (DP) is 279nm and 300nm, respectively.
Figure 3: Overlain spectra of MET and DP
Calibration Curves for MET and DP
The stock solution of drugs were appropriately diluted to obtain concentration range of 20 to 180µg/ml for MET and 5 to 35µg/ml and 3 to 24 µg/ml for DP. The absorption of the solution were measured at 279nm for
MET and 300nm, 279nm for DP respectively for absorption correction method. The Calibration curves of
MET and DP were plotted and are showing in fig. 4,5,6.
Figure 7: Zero Cross Point for MET and DP in First Order
Derivative Method
Figure 8: Calibration Curve of MET at 282.08 nm
Figure 4: Calibration Curve of MET at 279 nm
Figure 9: Calibration Curve of DP at 304.40 nm
Absorption correction method (Method I)
In this method, two wavelengths, 279nm (λ1) and 300 nm
(λ2) we re selected in such way that an absorbance of MET was nearly zero at the absorbance maximum of
DP(300nm). The concentration of two drugs in mixture was calculated by using following equations:
Figure 5: Calibration Curve of DP at 300 nm
International Journal of Pharmaceutical Sciences Review and Research Page 37
Available online at www.globalresearchonline.net
Int. J. Pharm. Sci. Rev. Res., 15(1), 2012; n ᵒ 08, 36-40 ISSN 0976 – 044X
A
1
and A
2
are the absorbencies of mixture at 300 nm and
279 nm; ax
1
, and ax
2
are the Absorptivities of DP at 300 nm and 279 nm, respectively; whereas ay
2
is the absorptivity of MET at 279 nm.
First Order Derivative Spectroscopy (Method II)
In this method, the sample solution was scanned in the spectrum mode from 190 nm to 400 nm. The absorption spectrum obtained was transformed to its first order derivative ( ∆ = 16 nm, and scaling factor 1). Amplitudes of first order derivative spectrum were measured at 302.40 nm for DP (zero cross for MET) and 282.08 nm for MET
(zero cross for DP). The concentration of the individual drug present in the mixture was determined by putting the amplitude values of first derivative in respective regression equations.
Analysis of Marketed Formulation
Twenty tablets of MET and DP were weighed and crushed to obtain fine powder. An accurately weighed tablet powder equivalent to about 50mg of MET and 6.25mg of
DP was transferred to 100 ml volumetric flask and sonicated for 10 minutes in 25ml in Methanol and made up the volume with methanol. The resulting solution was filtered through whatman filter paper no. 41. Filtrate was approp riately diluted to get concentration of 64 µg/ml for
MET and 8µg/ml for DP with methanol. The solution was scanned in range of 190-400 nm and the absorbance of solution was measured at 279 nm and 300 nm. The amount of MET and DP present in the tablets were calculated by putting the values of absorbance in the equations given in method I. For method II, the spectrum was transformed to first order derivative ( ∆λ = 16nm, and scaling factor 1) and the amplitudes were measured at
302.42 nm for DP and 282.08 nm for MET. The amount of
MET and DP present in the tablets were calculated using regression equations and results are reported in table 2.
Method Validation
The proposed methods of analysis for MET and DP in combination were validated as per the recommendations of ICH guidelines
14
for the parameters like accuracy, linearity, precision, detection limit and quantitation limit.
To study the accuracy of the proposed method, recovery studies were carried out by standard addition method at three different levels (80%, 100% and 120%). A known amount of MET and DP were added separately to preanalysed tablet powder and percent recoveries were calculated. The results of recovery studies were satisfactory and are presented in table 3.
Where, C
DP
and C
MET are the concentration of DP and MET respectively,
D
D is the amplitude of DP at 302.42 nm and is the amplitude of MET at 282.08 nm.
Table 1: Linear regression analysis of calibration curves with their respective absorptivity values.
Method-I Method-II
MET DP MET DP
Beer’s law limit (µg/ml) 20 to 180 5 to 35 3 to 24 20 to 180 5 to 40
Wavelength (nm)
R
2
279
0.9992
300
0.9995
279
0.9999
282.08
0.9994
302.40
0.9992
Slope
Intercept
LOD (µg/ml)
LOQ (µg/ml)
0.0054
1.8292
5.5431
0.0229 0.0403 -0.00026 -0.00127
0.0127 -0.0054 0.0039 -0.00022 0.00023
0.2962 0.3015 1.3924
0.8978 0.9137 4.2194
0.1771
0.5368
Table 2: Results of Marketed Formulation
Method Tablet content Label claim (mg/tablet) Amount Found in mg (n=6)
I
MET
DP
400
50
395.83
50.29
II
MET
DP
400
50
402.27
49.62
±SD % RSD
3.3115 0.8366
0.2663 0.5296
1.2445 0.3093
0.4865 0.9804
International Journal of Pharmaceutical Sciences Review and Research Page 38
Available online at www.globalresearchonline.net
Int. J. Pharm. Sci. Rev. Res., 15(1), 2012; n ᵒ 08, 36-40 ISSN 0976 – 044X
Level of recovery
Table 3: Level of Recovery Study
Drug
Method - I Method -II
Recovery (%) ±SD Recovery (%) ±SD
97.92 0.3600 97.76 0.4330
80%
MET
100%
120%
DP
MET
DP
MET
DP
100.05
102.07
99.33
101.57
99.16
0.7063
0.4429
0.3637
0.1443
0.9248
102.11
99.85
100.78
99.89
102.27
0.7101
0.7044
0.1154
0.2886
0.4734
Day
Intra day
Inter day
Table 4: Results of intermediate precisions
Method I (% RSD) Method II (% RSD)
MET
1.1696
0.9270
DP
1.015
0.9786
MET
1.1841
2.0141
DP
1.4226
2.0828
RESULTS AND DISCUSSION REFERENCES
MET and DP being freely soluble compounds in methanol, the stock solution of MET and DP were prepared in methanol. Further dilutions were made in methanol, 0.1
N hydrochloric acid, 0.1N sodium hydroxide and water.
Since hyperchromic effect was observed in methanol, further study was continued in the methanol. In absorption correction method, the Beer-Lambert’s concentration ranges were found to be 5-35 µg/ml for DP at 300 nm where as 20-180 µg/ml for MET at 279 nm. In first order derivative method, linearity was observed in the concentration ranges of 5-40 µg/ml for DP at 302.40 nm (Zero cross point for MET) where as 20-180 µg/ml for
MET at 282.08 nm (Zero cross point for DP).
1.
http://www.rxlist.com/skelaxin-drug.html
2.
http://www.drugs.com/pro/diclofenac- potassium.html
3.
Sznitowska M, Stokrocka M. Determination of diclofenac released from suppositories using UV spectrophotometry,
Spectra derivative Spectrophotometry and HPLC. Acta Pol
Pharm Drug Res 63(5): 2007; 401-5.
4.
Lohe RW, Suruse PB, Kale MK, Barethiya PR, Kasture AV,
Lohe SW. Spectrophotometric methods for simultaneous estimation of rabeprazole and diclofenac from combined tablet dosage form. Asian J Res Chem 1(1):2008; 26-8.
Precision of both the methods were calculated by interday and intraday variation study and % RSD of the observations were found to be less than 3%. When the marketed formulation was analysed using the proposed methods, the amount of MET and DP were found in the range from 98.26% to 100.97% and 98.43% to 100.95%, respectively. The accuracy of both the methods were determined at 80%, 100% and 120% levels and the percent recovery and results were found in the range from 97.51% to 102.56% for MET and 98.12% to 102.55% for DP.
5.
Jawla S. Atomic absorption spectrometric method for estimation of diclofenac sodium and mefenamic acid. Int J
Pharma Sci Drug Res 2(1): 2010; 45-7.
6.
Agrawal YK and Shivramchandra KA. Spectrophotometric determination of diclofenac sodium in tablets. J Pharm
Biomed Anal 09(2): 1991; 97 -100.
7.
Nagoji KEV, Kumar KM, Rao MEB, Kanna RKV.
Spectrophotometric method for simultaneous estimation of nimesulide and diclofenac sodium from combined dosage form. Indian J Pharma Sci 65(4):2003; 407-9.
CONCLUSION
8.
Subramanian G, Musmade P, Agarwal S, Udupa N.
Development of liquid chromatographic method for the simultaneous estimation of tizanidine, diclofenac potassium and paracetamol in tablets using carbamazepine as an internal standard. Indian J Pharm Sci 66(5):2004;
694-6.
The results of validation studies were found to be satisfactory for both methods hence, the proposed methods were found to be simple, accurate and rapid for the routine determination of MET and DP simultaneously in tablet dosage form.
9.
Elkady EF. Development of gradient elution based reversed phase liquid chromatographic method for the simultaneous determination of diclofenac potassium and methocarbamol. Talanta 82(4): 2010; 1604-07.
Acknowledgements: The authors shall remain grateful to
M/s RA Chem Pharma Ltd, Hyderabad, India and Wexford
Laboratories Pvt Ltd, Bangalore, India for providing
Metaxalone and Diclofenac potassium in the form of ‘Gift samples’ and Nargund College of Pharmacy, Bangalore for providing lab and research facilities to complete this project.
11.
Gowramma B, Rajan S, Muralidharan S, Meyyanathan SN ,
B Suresh Validation of RP-HPLC method for simultaneous estimation of diclofenac potassium and paracetamol in
International Journal of Pharmaceutical Sciences Review and Research Page 39
Available online at www.globalresearchonline.net
10.
Nagayalli D, Sankar ASK, Anandakumar K, Vetrichelvan T,
Balaji M. Development and validation of RP-HPLC method for the estimation of metaxalone in bulk material and in pharmaceutical formulation. Res J Pharm Tech 3(2):2010;
409-11.
Int. J. Pharm. Sci. Rev. Res., 15(1), 2012; n ᵒ 08, 36-40 ISSN 0976 – 044X pharmaceutical formulation. Int J Chem Tech Res 2
(1):2010; 676-80.
12.
Choudhary B, Goyal A, Khokra SL, D Kaushik. Simultaneous estimation of diclofenac sodium and rabeprazole by high performance liquid chromatographic method in combined dosage form. Int J Pharm Sci Drug Res 1(1):2009; 43-45. diclofenac in tablets and ointments by spectrofluorometry.
J Pharm Biomed Anal 20(3):1999; 587-90.
14.
ICH Guidance on Analytical Method Validation, in:
Proceedings of the International Convention on Quality for the Pharmaceutical Industry, Toronto, Canada, and
September, 2002.
13.
Damiani PC, Bearzotti M, Cabezón MA and Olivier C.
Development of analytical method for determination of
************************
International Journal of Pharmaceutical Sciences Review and Research Page 40
Available online at www.globalresearchonline.net
