Mecklenburg County 2014 Fleet Inventory
advertisement
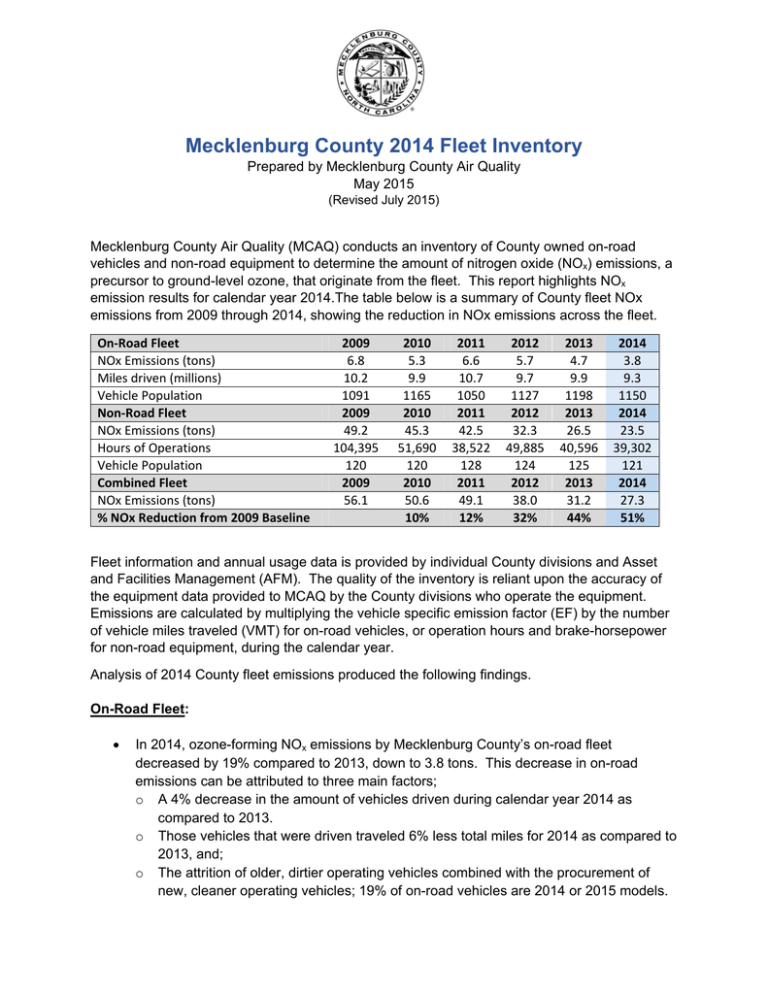
Mecklenburg County 2014 Fleet Inventory Prepared by Mecklenburg County Air Quality May 2015 (Revised July 2015) Mecklenburg County Air Quality (MCAQ) conducts an inventory of County owned on-road vehicles and non-road equipment to determine the amount of nitrogen oxide (NOx) emissions, a precursor to ground-level ozone, that originate from the fleet. This report highlights NOx emission results for calendar year 2014.The table below is a summary of County fleet NOx emissions from 2009 through 2014, showing the reduction in NOx emissions across the fleet. On‐Road Fleet NOx Emissions (tons) Miles driven (millions) Vehicle Population Non‐Road Fleet NOx Emissions (tons) Hours of Operations Vehicle Population Combined Fleet NOx Emissions (tons) % NOx Reduction from 2009 Baseline 2009 2010 2011 2012 2013 2014 6.8 5.3 6.6 5.7 4.7 3.8 10.2 9.9 10.7 9.7 9.9 9.3 1091 1165 1050 1127 1198 1150 2009 2010 2011 2012 2013 2014 49.2 45.3 42.5 32.3 26.5 23.5 104,395 51,690 38,522 49,885 40,596 39,302 120 120 128 124 125 121 2009 2010 2011 2012 2013 2014 56.1 50.6 49.1 38.0 31.2 27.3 10% 12% 32% 44% 51% Fleet information and annual usage data is provided by individual County divisions and Asset and Facilities Management (AFM). The quality of the inventory is reliant upon the accuracy of the equipment data provided to MCAQ by the County divisions who operate the equipment. Emissions are calculated by multiplying the vehicle specific emission factor (EF) by the number of vehicle miles traveled (VMT) for on-road vehicles, or operation hours and brake-horsepower for non-road equipment, during the calendar year. Analysis of 2014 County fleet emissions produced the following findings. On-Road Fleet: In 2014, ozone-forming NOx emissions by Mecklenburg County’s on-road fleet decreased by 19% compared to 2013, down to 3.8 tons. This decrease in on-road emissions can be attributed to three main factors; o A 4% decrease in the amount of vehicles driven during calendar year 2014 as compared to 2013. o Those vehicles that were driven traveled 6% less total miles for 2014 as compared to 2013, and; o The attrition of older, dirtier operating vehicles combined with the procurement of new, cleaner operating vehicles; 19% of on-road vehicles are 2014 or 2015 models. On-road fleet vehicles are averaging less NOx emissions for each mile driven. NOx emissions per mile driven decreased to 0.37 grams/mile in 2014 compared to 0.61 grams/mile in 2009. 90% of the on-road NOx emissions were generated from heavy-duty (HD) vehicles, which comprise only 19% of the County on-road fleet. Light-duty (LD) vehicels make up the majority of the on-road fleet but emit far less NOx. Non-Road Fleet: The overall NOx emissions from County owned non-road fleet in 2014 decreased to 23.5 tons. This 11% decrese in non-road emissions can be attributed to three main factors: o A 3% decrease in the amount of equipment operated in 2014 compared to 2013. o The equipment operated in 2014 had a 3% reduction in overall usage hours. o Efforts by all divisions to retire older, lower tier engines and purchase newer higher tier engines, when needed. Of the top 20 NOx producing equipment in 2014, all have a tier 2 engine or cleaner. Seven of the top twenty NOx producers are tier 4 certified, meaning they are the cleanest engines currently available. See Apendix C. While most of the County’s non-road NOx emissions come from equipment operated by the Solid Waste Division, their equipment has the lowest emission rate per bhp-hr and they continue to reduce their overall NOx emissions year after year. Combined Fleet: In 2014, fleet NOx emissions were 51% less than emissions from the baseline year 2009. Emissions from both the onroad and non-road fleets have decreased by approximately half, showcasing the efforts made by County Departments to reduce their emissions from each fleet sector. The non-road fleet emited a larger portion of NOx emissions compared to on-road, while having a smaller population of equipment. This is due to the HD diesel engines used in non-road equipment polluting at a higher rate than on-road vehicel engines. Nearly 92% of fleet NOx emissions came from one County Department, Land Use and Environmental Sevices Agency (LUESA), which includes Solid Waste, Water and Land Resources, Air Quality, Fleet Composition 16% 10% 74% On‐Road LD On‐Road HD Non‐Road HD Total NOx Emissions 3% 12% 85% On‐Road LD On‐Road HD Non‐Road HD Geospatial Information Sevices and Code Enforcement. These divisions require daily field work and often times heavy duty vehicles and equipment to conduct their core job duties. LUESA therefore, has the largest number of vehicles and non-road equipment with the highest VMT and operating hours of all County Departments. Discussion: The County should continue to consider the following factors when evaluating fleet vehicles and equipment to pursue NOx emission reductions. Evaluate the replacement schedule and usage of heavy duty vehicles and non-road equipment, which contribute a disproportionate amount of NOx emissions in the County’s inventory. Right-size vehicles and equipment so employees are using the most efficient model to perform the required job. Retire older vehicels and equipment, and replace them (if nessecary) with newer, cleaner vehicles. Optimize trip/service areas to reduce travel distance between required service calls. Allocate the cleanest vehicles to the drivers who travel the most miles each year. While there are still opportunities to reduce fleet emissions, significant, rapid emission reductions will become less feasible to achieve in the future. The County currently has a fairly clean fleet: 36% of the on-road fleet is less than 5 years old and 29% of the non-road fleet is at least a tier 3. Given the smaller emission footprint of the County fleet, there is less opportunity for emission reductions on the same scale as past reductions, given currently available technology. Significant financial resources will have to be used to upgrade higher-emission nonroad equipment, but since much of this equipment is already relatively clean, these upgrades will result in less significant emission reductions. In other words, NOx emission reductions will become more expensive per ton reduced than they have been previously. Although new federal standards going into effect in 2017 will reduce emissions from onroad vehicles, the new standards will not impact non-road equipment, which is the County's largest source of NOx. The attached appendices show the top 20 highest NOx emitting vehicles and equipment for each fleet sector. MCAQ will assist individual County Department and Divisions with identifying strategies to reduce emissions from these vehicles. Appendix A: Top 20 Light-Duty On-Road Vehicles EQUIP # Full Description YEAR VEHICLE MAKE MODEL 4196 4193 4121 3974 3683 3972 3968 3587 3962 3824 3601 4130 4126 4132 4100 3684 4421 4191 4386 4035 Business and Financial Management Park and Recreation ‐East LUESA ‐ Code Enforcement Park and Recreation Park and Recreation ‐ Park Repair Park and Recreation Park and Recreation LUESA ‐ Code Enforcement LUESA ‐ Code Enforcement Sheriff ‐ WRRC LUESA ‐ Air Quality ‐ Lab LUESA ‐ Code Enforcement LUESA ‐ Code Enforcement LUESA ‐ Code Enforcement LUESA ‐ Code Enforcement Park and Recreation ‐ NR/CONS Park and Recreation ‐ Admin. Park and Recreation ‐ North Park and Recreation Sheriff ‐ WRRC 2006 2006 2006 2004 2001 2004 2004 2000 2004 2002 2000 2006 2006 2006 2005 2001 2007 2006 2007 2004 Chevrolet Chevrolet Chevrolet Chevrolet Chevrolet Chevrolet Chevrolet Chevrolet Chevrolet Ford Chevrolet Chevrolet Chevrolet Chevrolet Chevrolet Chevrolet Ford Chevrolet Ford Chevrolet C‐1500 C‐1500 Colorado C‐1500 K‐1500 C‐1500 C‐1500 C‐1500 C‐1500 Crown Victoria G‐1500 Colorado Colorado Colorado Trail Blazer K‐1500 E‐150 C‐1500 F‐150 Tahoe FUEL TYPE Class Gasoline Gasoline Gasoline Gasoline Gasoline Gasoline Gasoline Gasoline Gasoline Gasoline Gasoline Gasoline Gasoline Gasoline Gasoline Gasoline Gasoline Gasoline Gasoline Gasoline LD LD LD LD LD LD LD LD LD LD LD LD LD LD LD LD LD LD LD LD VMT for 2014 18826 14600 27626 13802 8432 10973 10541 6351 10372 19433 3805 18941 18640 17640 26300 5366 5715 8307 23677 7490 NOx NOx EF Emissions (g/mi) (tons) 0.60 0.60 0.30 0.60 0.98 0.60 0.60 0.98 0.60 0.30 1.53 0.30 0.30 0.30 0.20 0.98 0.90 0.60 0.20 0.60 0.0125 0.0097 0.0091 0.0091 0.0091 0.0073 0.0070 0.0069 0.0069 0.0064 0.0064 0.0063 0.0062 0.0058 0.0058 0.0058 0.0057 0.0055 0.0052 0.0050 Appendix B: Top 20 Heavy-Duty On-road Vehicles Equip # Department ‐ Description 825 826 828 833 9816 827 829 824 9817 3990 4113 4027 4016 4031 890 830 914 4153 4616 4029 LUESA ‐ Solid Waste ‐ Recycling LUESA ‐ Solid Waste ‐ Recycling LUESA ‐ Solid Waste ‐ Recycling LUESA ‐ Solid Waste ‐ Recycling LUESA ‐ Storm Water Operations LUESA ‐ Solid Waste ‐ Compost LUESA ‐ Solid Waste ‐ Recycling LUESA ‐ Solid Waste ‐ Recycling LUESA ‐ Storm Water Operations DSS ‐ Services for Adults LUESA ‐ Water & Land Resources PARK & RECREATION ‐ Park Repair PARK & RECREATION ‐ Park Repair PARK & RECREATION ‐ Central III LUESA ‐ Storm Water Operations LUESA ‐ Solid Waste ‐ Compost LUESA ‐ Solid Waste ‐ Compost PARK & RECREATION ‐ East LUESA ‐ Storm Water Operations PARK & RECREATION ‐ Turf/Irrigation Year 2001 2003 2005 2009 1986 2005 2007 2000 1986 2004 1996 2005 2005 2005 1989 2007 2009 2006 2009 2005 Vehicle Make Freight. Volvo Mack Volvo Freightliner Freight. Volvo Freightliner Freightliner Ford GMC Ford Freightliner Chevrolet Ford GMC GMC Chevrolet Sterling Chevrolet Model Fuel Type Class VMT for 2014 NOx EF (g/mi) NOx Emissions (tons) D13 VED12 CV713 D13 Tandem Dump M2112 VED12 FL80 Tandem Dump E‐450 Top Kick Dump F‐450 M2106 C‐3500 C/C F‐800 Dump TC8C042 TC7C042 C‐3500 C/C Tandem Dump C‐3500 C/C Diesel Diesel Diesel Diesel Diesel Diesel Diesel Diesel Diesel HD HD HD HD HD HD HD HD HD HD HD HD HD HD HD HD HD HD HD HD 21,075 31,267 25,268 41,178 6,528 10,711 27,459 6,062 3,847 17,856 4,172 13,100 5,813 13,734 2,730 19,157 10,618 11,958 9,445 9,651 11.21 7.27 8.48 3.33 15.96 7.32 2.64 11.51 15.96 3.18 12.42 3.50 7.32 3.00 14.10 1.93 3.28 2.88 3.09 3.00 0.260 0.251 0.236 0.151 0.115 0.086 0.080 0.077 0.068 0.063 0.057 0.051 0.047 0.045 0.042 0.041 0.038 0.038 0.032 0.032 Gasoline Diesel Diesel Diesel Diesel Diesel Diesel Diesel Diesel Diesel Diesel Appendix C: Top 20 Heavy-Duty Non-Road Equipment Department Solid Waste Solid Waste Solid Waste Solid Waste Solid Waste Solid Waste Solid Waste Solid Waste Solid Waste Solid Waste Solid Waste Solid Waste Solid Waste Solid Waste Solid Waste Solid Waste Solid Waste Solid Waste Solid Waste Solid Waste Equipment Description/ID SWZ937 Diamond Z 1460b‐45 SWZ938 Diamond Z 1460B‐46 Compactor Cat 826G SWL 227 Loader Volvo L70F SWL 218 Loader John Deere 544J SWL 224 Volvo L70F Compactor Cat 826H SWL 221 Wheel Loader John Deere 544J Excavator Komatsu 300‐7 Dozer Cat D6TWH Off‐road Truck Volvo A30 F SWZ934 Screener McCloskey 621RE SWZ932 Screener Power Screen 1600 SWL 223 Volvo L70F Dozer Cat D7R SWL 222 Wheel Loader John Deere 544J SWL226 Loader John Deere 644K SWL220 Loader John Deere 444J SWT 504 Cat 320 D Dozer Cat D6TLGP Model Year Emission Tier Engine Hp Fuel Type Hours Operated NOx EF (g/bhp‐hr) NOx Emissions (tons) 2011 2011 2004 2011 2007 2011 2012 2008 2007 2011 2012 2006 2005 2011 2004 2008 2013 2008 2011 2011 4 4 2 3 3 3 4 3 3 4 4 2 2 3 2 3 4 3 3 4 1000 1000 380 169 149 150 425 149 184 227 315 170 170 150 258 149 180 149 147 227 Diesel Diesel Diesel Diesel Diesel Diesel Diesel Diesel Diesel Diesel Diesel Diesel Diesel Diesel Diesel Diesel Diesel Diesel Diesel Diesel 1053 845 1225 1918 1732 1686 1085 1513 1212 1822 1214 714 707 1239 437 1201 1888 1178 1065 1296 2.6 2.6 4.56 2.85 2.85 2.85 1.49 2.85 2.85 1.49 1.49 4.65 4.65 2.85 4.65 2.85 1.49 2.85 2.85 1.49 3.02 2.42 2.34 1.02 0.81 0.79 0.76 0.71 0.70 0.68 0.63 0.62 0.62 0.58 0.58 0.56 0.56 0.55 0.49 0.48
