Research Journal of Applied Sciences, Engineering and Technology 12(5): 556-561,... DOI:10.19026/rjaset.12. 2683
advertisement
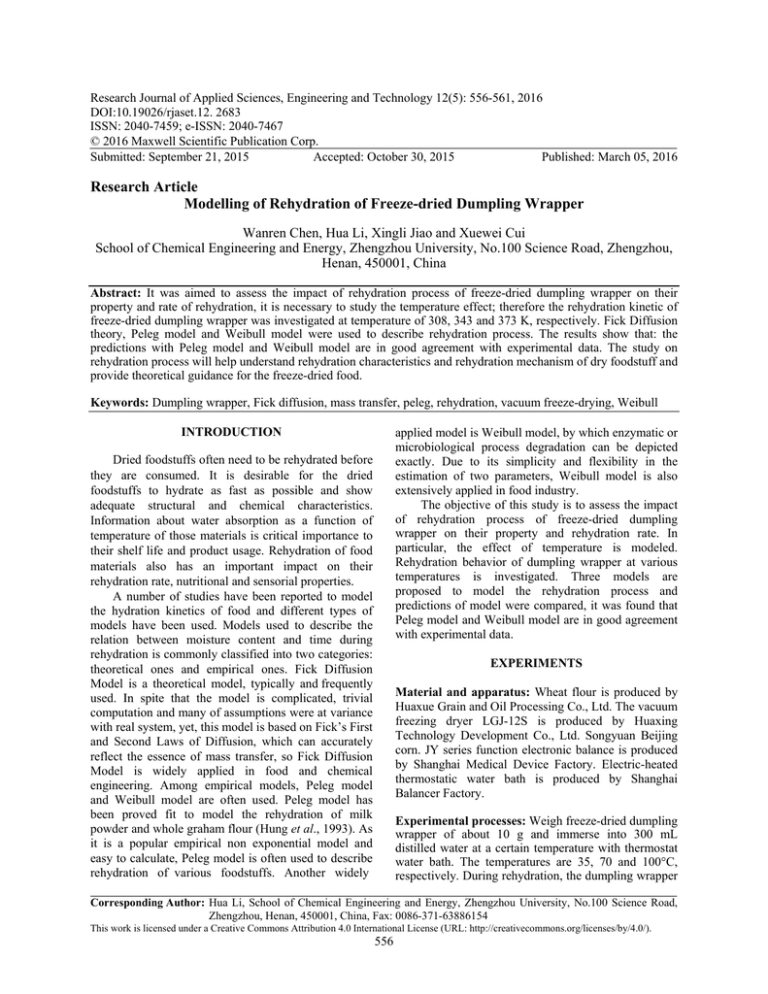
Research Journal of Applied Sciences, Engineering and Technology 12(5): 556-561, 2016 DOI:10.19026/rjaset.12. 2683 ISSN: 2040-7459; e-ISSN: 2040-7467 © 2016 Maxwell Scientific Publication Corp. Submitted: September 21, 2015 Accepted: October 30, 2015 Published: March 05, 2016 Research Article Modelling of Rehydration of Freeze-dried Dumpling Wrapper Wanren Chen, Hua Li, Xingli Jiao and Xuewei Cui School of Chemical Engineering and Energy, Zhengzhou University, No.100 Science Road, Zhengzhou, Henan, 450001, China Abstract: It was aimed to assess the impact of rehydration process of freeze-dried dumpling wrapper on their property and rate of rehydration, it is necessary to study the temperature effect; therefore the rehydration kinetic of freeze-dried dumpling wrapper was investigated at temperature of 308, 343 and 373 K, respectively. Fick Diffusion theory, Peleg model and Weibull model were used to describe rehydration process. The results show that: the predictions with Peleg model and Weibull model are in good agreement with experimental data. The study on rehydration process will help understand rehydration characteristics and rehydration mechanism of dry foodstuff and provide theoretical guidance for the freeze-dried food. Keywords: Dumpling wrapper, Fick diffusion, mass transfer, peleg, rehydration, vacuum freeze-drying, Weibull INTRODUCTION applied model is Weibull model, by which enzymatic or microbiological process degradation can be depicted exactly. Due to its simplicity and flexibility in the estimation of two parameters, Weibull model is also extensively applied in food industry. The objective of this study is to assess the impact of rehydration process of freeze-dried dumpling wrapper on their property and rehydration rate. In particular, the effect of temperature is modeled. Rehydration behavior of dumpling wrapper at various temperatures is investigated. Three models are proposed to model the rehydration process and predictions of model were compared, it was found that Peleg model and Weibull model are in good agreement with experimental data. Dried foodstuffs often need to be rehydrated before they are consumed. It is desirable for the dried foodstuffs to hydrate as fast as possible and show adequate structural and chemical characteristics. Information about water absorption as a function of temperature of those materials is critical importance to their shelf life and product usage. Rehydration of food materials also has an important impact on their rehydration rate, nutritional and sensorial properties. A number of studies have been reported to model the hydration kinetics of food and different types of models have been used. Models used to describe the relation between moisture content and time during rehydration is commonly classified into two categories: theoretical ones and empirical ones. Fick Diffusion Model is a theoretical model, typically and frequently used. In spite that the model is complicated, trivial computation and many of assumptions were at variance with real system, yet, this model is based on Fick’s First and Second Laws of Diffusion, which can accurately reflect the essence of mass transfer, so Fick Diffusion Model is widely applied in food and chemical engineering. Among empirical models, Peleg model and Weibull model are often used. Peleg model has been proved fit to model the rehydration of milk powder and whole graham flour (Hung et al., 1993). As it is a popular empirical non exponential model and easy to calculate, Peleg model is often used to describe rehydration of various foodstuffs. Another widely EXPERIMENTS Material and apparatus: Wheat flour is produced by Huaxue Grain and Oil Processing Co., Ltd. The vacuum freezing dryer LGJ-12S is produced by Huaxing Technology Development Co., Ltd. Songyuan Beijing corn. JY series function electronic balance is produced by Shanghai Medical Device Factory. Electric-heated thermostatic water bath is produced by Shanghai Balancer Factory. Experimental processes: Weigh freeze-dried dumpling wrapper of about 10 g and immerse into 300 mL distilled water at a certain temperature with thermostat water bath. The temperatures are 35, 70 and 100°C, respectively. During rehydration, the dumpling wrapper Corresponding Author: Hua Li, School of Chemical Engineering and Energy, Zhengzhou University, No.100 Science Road, Zhengzhou, Henan, 450001, China, Fax: 0086-371-63886154 This work is licensed under a Creative Commons Attribution 4.0 International License (URL: http://creativecommons.org/licenses/by/4.0/). 556 Res. J. App. Sci. Eng. Technol., 12(5): 556-561, 2016 need to weigh every now and then and water on the surface is removed by filter paper. When the deviation of mass for two times is less than 0.01 g, moisture content has reached equilibrium and rehydration process is finished. Statistical analyses: The model was evaluated by Root Mean Square Deviation (RMSD), SSE (Sum of Square Error) and RAD (Relative Average Deviation), which are defined as (Sopade et al., 1992): RMSD Models: Fick diffusion law: Fick’s Second Law was applied to obtain diffusion coefficient in this study and the formula can be expressed by Eq. (1). The equation is under these assumptions (Crank, 1975; García et al., 2006): initial moisture content is same, there’s no shrinkage, diffusion coefficient is a constant at a certain temperature: M t M e (M 0 M e ) 8 2 exp( Dwe 2t ) 4 L2 Peleg model: The expression of Peleg model is as follow (Peleg, 1988): Mt M0 t k1 k2t (2) where, M0 and Mt refer to the initial moisture content and moisture content at time t (g H2O/g dry material); k1(s/% ) and k2 (% -1) are two parameters for Peleg model. As rehydration process is unlike dehydration process, equilibrium moisture content cannot be measured. Besides, the long soaking time will bring many changes in the structures and properties of foodstuffs, so it is very hard to establish equilibrium. Equilibrium moisture content Me is expressed by Eq. (3): Me M0 1 k2 t M t M e ( M 0 M e ) exp[ ( ) ] (4) where, M0, Mt and Me refers to the initial moisture content, moisture content at time t and equilibrium moisture content (g H2O/g dry material); α β are two parameters for Weibull model which are called shape parameter and scale parameter, respectively. i 1 ei M ci ) 2 (5) 1 n ( M ei M ci )2 n i 1 (6) RAD 1 n M ei M ci M n i1 ei (7) RESULTS AND DISCUSSION Fick diffusion: Take the logarithm treatment to both sides of Eq. (5), then Eq. (9) was obtained: ln( 8 D 2 Mt Me ) ln 2 we 2 t 4L M0 Me (8) A plot of ln[(Mt-Me)/(M0-Me)]verse t yields a straight line with slope being -Dweπ2/4L2 from which Dwe can be calculated. The plot of ln[(Mt-Me)/(M0Me)]~t was shown in Fig. 1. It can be found from Fig. 1 that there are two stages in each rehydration curve, indicating that rehydration process is mainly composed of two different stages, namely initial stage and final stage, each of which has an effective diffusion coefficient shown in Table 1. From Table 1, effective diffusion coefficients D1, D2 increased as temperature increased at the initial stage and final stage. Moreover, D1 is larger than D2 obviously at constant temperature, implying the water absorption rate at the initial stage is quicker than that of last stage. According to diffusion theory, the diffusion of liquid and gas in porous materials depends on molecular transition. And diffusion coefficient can be expressed by Eq. (10) (Crank and Park, 1968): (3) Weibull model: The expression of Weibull model is shown as follow (Machado et al., 1999): n (M SSE (1) where, M0, Mt and Me is the initial moisture content, moisture content at time t and equilibrium moisture content (g H2O/g dry material); Dwe is diffusion coefficient; 2L is the thickness of sample. 1 n 1 D 2 6 (9) where, δ : To transition distance from one cell to adjacent cell in the solid Φ : Means the number of molecules that diffuse in unit time within δ D : Diffusion coefficient The frequency of molecule transition Φ depends on the diffusion energy, which is determined by its temperature. Nevertheless, as there is no equation to express the relationship between frequency of molecule 557 Res. J. App. Sci. Eng. Technol., 12(5): 556-561, 2016 0.0 ln(Xt-Xe)/(X0-Xe) -1.5 -3.0 -4.5 -6.0 0 200 400 600 800 1000 120 time/s Fig. 1: Plot of ln[(Mt-Me)/(M0-Me)] versa t at different temperatures ■, 308 K; □, 343 K; ▲, 373 K Table 1: Effective diffusion coefficients of freeze-dried dumpling wrapper at different temperatures D1/m2 s-1 R2 Time/s Temperature/k Time/s 308 0~180 2.271×10⁻⁹ 0.991 180~840 343 0~135 3.362×10⁻⁹ 0.992 135~960 373 0~180 4.461×10⁻⁹ 0.971 180~900 Table 2: Parameters of Peleg model for freeze-dried dumpling wrapper at different temperatures Xe/g Temperature/k water/g d m K1/s K2 R2 308 161.556 1.123 0.997 0.890 343 91.630 1.098 0.999 0.911 373 49.756 1.093 0.996 0.915 Table 3: Parameters of Weibull model for freeze-dried dumpling wrapper at different temperatures Xe/g water / Temperature/k gdm R2 Α Β/s 308 0.621 230.361 0.902 0.989 343 0.751 110.858 0.890 0.985 373 0.809 65.085 0.909 0.987 transition Φ and temperature, so only qualitative method is available for the description of relationship between them. From Eq. (10), as temperature increases, water molecules obtain more energy from surroundings and move much fiercely, leading to the increase of Φ and diffusion coefficient. The positive correlation between effective diffusion coefficient and temperature has been confirmed by many references (Sanjuán et al., 2001; Doymaz, 2004; Kaptso et al., 2008). Peleg model: Peleg model parameters for freeze-dried dumpling wrapper at different temperatures were shown in Table 2. Table 2, k1 decreased with the increase of temperature. As k1 is related with mass transfer rate, the smaller k1 is, the higher water uptake rate is, which is in accordance with the fact that rehydration rate at higher temperature is higher too. At the same time, k2 was found to be a function of temperature, decreasing as temperature increased. As k2 is related with water D2/m2 s-1 0.818×10⁻⁹ 0.971×10⁻⁹ 1.542×10⁻⁹ R2 0.983 0.980 0.983 holding capacity of material shown in Eq. (3), the minimum value of k2 means the strongest water holding capacity and vice versa (Solomon, 2007). It also can be seen from Eq. (3) that the tendency of equilibrium moisture content with temperature is the same as k2. As k1, k2 both showed a certain relationship with temperature from Table 2, two equations were applied to illustrate the correlations, shown in Eq. (12, 13). k1, k2 were substituted into Eq. (2) and a new equation was proposed that can describe the relationship between moisture content, time and temperature, expressed by Eq. (11). Since k1, k2 are influenced by materials’ intrinsic characteristic and external conditions, Eq. (11) is only suitable for the experiment system in this study. Any change in variety of dehydrated products or rehydration conditions will bring Eq. (11) moderate revision. Mt M0 t (1.72766T 690.68819) (0.00046T 1.26458)t (10) k1 = -1.72766T+690.68819 (11) k2 = -0.00046T+1.26458 (12) Weibull model: Weibull model parameters for freezedried dumpling wrapper at different temperatures were shown in Table 3. In Weibull model, α is called shape parameter, which increased with the increase of temperature shown in Table 3. As a shape parameter, different shapes of foodstuff will lead to different values of α. In this study, 558 Res. J. App. Sci. Eng. Technol., 12(5): 556-561, 2016 1.0 Mt / g water /g d m 0.8 0.6 0.4 0.2 0.0 0 200 400 600 800 1000 1200 t /s Fig. 2: Peleg constants k1, k2 versa t at different rehydration temperatures ■, k1; □, k2 1.0 Mt /g water /g d m 0.8 0.6 0.4 0.2 0.0 0 200 400 600 800 1000 1200 t /s Fig. 3: Experimental and predicted moisture content by Fick Diffusion Law for rehydration of dumpling wrapper at different temperatures, ■, 308 K;□,343 K;▲,373 K; -predicted data since the shape of dumpling wrapper is constant and different values of α at different rehydration temperatures indicate a co-relationship between α and temperature. Yet, it was considered there was no relationship between the parameter and temperature. Therefore, it is worth nothing even though the two parameters show a positive correlation and thus α can be regarded as a constant independent of temperature (Abu-Ghannam and McKenna, 1997). Therefore, it is believed that in this study apart from the factor of foodstuff shape, α might also be influenced by the experimental conditions like temperature. Besides, α not only reflects material shape, but also might be related with water uptake rate during rehydration. Meanwhile β in Table 3 decreased with increasing temperature. Its reciprocal is similar to effective diffusion coefficient in Fick Diffusion Law, which represents kinetics parameter in Weibull model and measures the difficulty or facility degree of material to rehydrate. β is the time by which 63% of process has been carried out (Saguy et al., 2005). The smaller β is, the higher rehydration rate is. From Table 3, it can be seen that β decreased as temperature increased, indicating water uptake rate at higher temperature is larger than at lower temperature. Also from Fig. 5, it is very obvious that rehydration rate at 373 K is larger than 308 K and 343 K. Statistical analyses: The mean values of RMSD RAD and SSE in Eq. (5, 7 and 6) for each model at different temperatures were listed in Table 4 and comparison between theoretical values and experimental values was shown in Fig. 2 to 5. 559 Res. J. App. Sci. Eng. Technol., 12(5): 556-561, 2016 1.0 Mt / g water /g d m 0.8 0.6 0.4 0.2 0.0 0 200 400 600 800 1000 1200 t /s Fig. 4: Experimental and predicted moisture content by Peleg model for rehydration of dumpling wrapper at different temperatures ■, 308 K; □, 343 K;▲,373 K; -predicted data 1.0 Mt /g water /g d m 0.8 0.6 0.4 0.2 0.0 0 200 400 600 800 1000 1200 t /s Fig. 5: Experimental and predicted moisture content by Weibull model for rehydration of dumpling wrapper at different temperatures ■, 308 K; □,343 K;▲,373 K; -predicted data Table 4: Statistical analysis for each model Means of Fick diffusion statistical tests model Peleg model RMSD 0.02527 0.00587 RAD 0.43676 0.03676 SSE 0.00830 0.00069 Weibull model 0.00649 0.04957 0.00084 In general, each model can fit the rehydration data appropriately, among which Peleg model and Weibull model show better fitting accuracy than Fick Diffusion Law, indicating that the mass transfer mechanism during rehydration of freeze-dried dumpling wrapper is not Fick Diffusion Law. This might be because freezedried foodstuffs have plentiful micro pores brought by the particular drying method and the mass transfer mechanism of rehydration is capillary imbibition instead of Fick Diffusion Law while the mechanism for air-dried products is Fick Diffusion Law (Marabi et al., 2003). The rehydration kinetics at different temperatures with different models was showed in Fig. 3 to 5 and the difference between experimental and predicted data can be seen from these figures, too. Though Fick Diffusion Law in Fig. 3 can predict the equilibrium moisture content, yet the difference between experimental and predicted data is much larger, which suggests the mass transfer mechanism is not governed by Fick Diffusion Law from another point of view. CONCLUSION Rehydration behavior of dumpling wrapper at various temperatures is investigated; rehydration of food is greatly influenced by temperature. Fick Diffusion Law, Peleg model and Weibull model were applied to model rehydration process and predicted 560 Res. J. App. Sci. Eng. Technol., 12(5): 556-561, 2016 equilibrium water content. Comparing with model predictions, it is found that Peleg model and Weibull model are in good agreement with experimental data, which is helpful to understand the transfer mechanism during rehydration process. REFERENCES Abu-Ghannam, N. and B. McKenna, 1997. The application of Peleg’s equation to model water absorption during the soaking of red kidney beans (Phaseolus vulgaris L.). J. Food Eng., 32(4): 39l-401. http://www.sciencedirect.com/science/ article/pii/S0260877497000344. Crank, J., 1975. The Mathematics of Diffusion. Oxford University Press, London. Crank, J. and G.S. Park, 1968. Diffusion in Polymers. Academic Press, London and New York. onlinelibrary.wiley.com/doi/10.1002/app.1970.070 140623/abstract. Doymaz, I., 2004. Convective air drying characteristics of thin layer carrots. J. Food Eng., 61(3): 359-364. http://www.sciencedirect.com/science/article/pii/S0 260877403001420. García, P.P., N. Sanjuán, R. Melis and A. Mulet, 2006. Morchella Esculenta (morel) rehydration process modeling. J. Food Eng., 72(4): 346-353. http://www.sciencedirect.com/science/article/pii/S0 260877405000178. Hung, T.V., L.H. Liu, R.G. Black and M.A. Trewhella, 1993. Water absorption in chickpea (C. arietinum) and field pea (P. sativum) cultivars using the Peleg model. J. Food Sci., 58(4): 848-852. http://onlinelibrary.wiley.com/doi/ 10.1111/j.13652621.1993.tb09374.x/abstract. Kaptso, K.G., Y.N. Njintang, A.E. Komnek, J. Hounhouigan, J. Scher and C.M.F. Mbofung, 2008. Physical properties and rehydration kinetics of two varieties of cowpea (Vigna unguiculata) and bambara groundnuts (Voandzeia subterranea) seeds. J. Food Eng., 86(1): 91-99. http://www. sciencedirect.com/science/article/pii/S0260877407 00489X. Machado, M.F., F.A. Oliveira and L.M. Cunha, 1999. Effect of milk fat and total solids concentration on the kinetics of moisture uptake by ready-to-eat breakfast cereal. Int. J. Food Sci. Tech., 34(1): 47-57. http://onlinelibrary.wiley.com/doi/10.1046/ j.1365-2621.1999.00238.x/abstract. Marabi, A., S. Livings, M. Jacobson and I.S. Saguy, 2003. Normalized Weibull distribution for modeling rehydration of food particulates. Eur. Food Res. Technol., 217(4): 311-318. Peleg, M., 1988. An empirical model for the description of moisture sorption curves. J. Food Sci., 53(4): 1216-1219. http://onlinelibrary.wiley.com/doi/ 10.1111/j.13652621.1988.tb13565.x/abstract. Saguy, S., A. Marabi and R. Wallach, 2005. New approach to model rehydration of dry food particulates utilizing principles of liquid transport in porous media. Trends Food Sci. Technol., 16(11): 495-506. http://www.sciencedirect.com/ science/article/pii/S0924224405001627. Sanjuán, N., J.A. Cárcel, G. Clemente and A. Mulet, 2001. Modelling of the rehydration process of brocolli florets. Eur. Food Res. Technol., 212(4): 449-453. http://link.springer.com/article/10.1007/ s002170000277#page-1. Solomon, W.K., 2007. Hydration kinetics of lupin (Lupinus Albus) seeds. J. Food Process Eng., 30(1): 119-130. http://onlinelibrary.wiley.com/doi/ 10.1111/j.1745-4530. 2007.00098.x/abstract. Sopade, P.A., E.S. Ajisegiri and M.H. Badau, 1992. The use of Peleg’s equation to model water absorption in some cereal grains during soaking. J. Food Eng., 15(4): 269-283. http://www. sciencedirect.com/science/article/pii/02608774929 00104. 561
