Research Journal of Applied Sciences, Engineering and Technology 7(19): 4100-4105,... ISSN: 2040-7459; e-ISSN: 2040-7467
advertisement
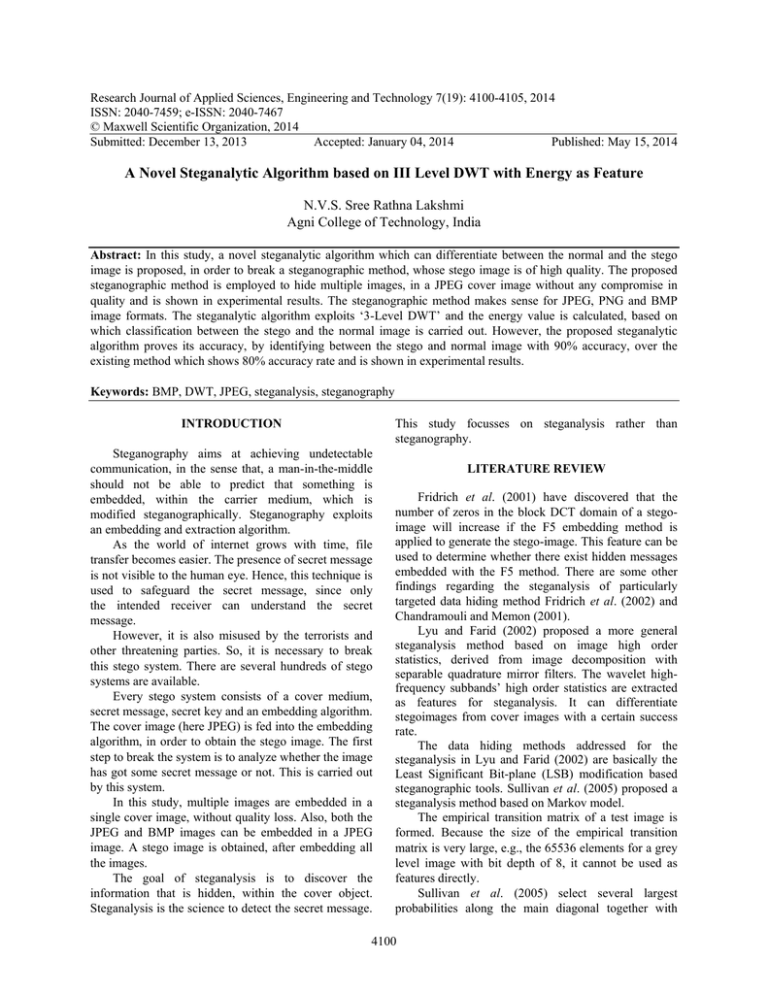
Research Journal of Applied Sciences, Engineering and Technology 7(19): 4100-4105, 2014 ISSN: 2040-7459; e-ISSN: 2040-7467 © Maxwell Scientific Organization, 2014 Submitted: December 13, 2013 Accepted: January 04, 2014 Published: May 15, 2014 A Novel Steganalytic Algorithm based on III Level DWT with Energy as Feature N.V.S. Sree Rathna Lakshmi Agni College of Technology, India Abstract: In this study, a novel steganalytic algorithm which can differentiate between the normal and the stego image is proposed, in order to break a steganographic method, whose stego image is of high quality. The proposed steganographic method is employed to hide multiple images, in a JPEG cover image without any compromise in quality and is shown in experimental results. The steganographic method makes sense for JPEG, PNG and BMP image formats. The steganalytic algorithm exploits ‘3-Level DWT’ and the energy value is calculated, based on which classification between the stego and the normal image is carried out. However, the proposed steganalytic algorithm proves its accuracy, by identifying between the stego and normal image with 90% accuracy, over the existing method which shows 80% accuracy rate and is shown in experimental results. Keywords: BMP, DWT, JPEG, steganalysis, steganography INTRODUCTION This study focusses on steganalysis rather than steganography. Steganography aims at achieving undetectable communication, in the sense that, a man-in-the-middle should not be able to predict that something is embedded, within the carrier medium, which is modified steganographically. Steganography exploits an embedding and extraction algorithm. As the world of internet grows with time, file transfer becomes easier. The presence of secret message is not visible to the human eye. Hence, this technique is used to safeguard the secret message, since only the intended receiver can understand the secret message. However, it is also misused by the terrorists and other threatening parties. So, it is necessary to break this stego system. There are several hundreds of stego systems are available. Every stego system consists of a cover medium, secret message, secret key and an embedding algorithm. The cover image (here JPEG) is fed into the embedding algorithm, in order to obtain the stego image. The first step to break the system is to analyze whether the image has got some secret message or not. This is carried out by this system. In this study, multiple images are embedded in a single cover image, without quality loss. Also, both the JPEG and BMP images can be embedded in a JPEG image. A stego image is obtained, after embedding all the images. The goal of steganalysis is to discover the information that is hidden, within the cover object. Steganalysis is the science to detect the secret message. LITERATURE REVIEW Fridrich et al. (2001) have discovered that the number of zeros in the block DCT domain of a stegoimage will increase if the F5 embedding method is applied to generate the stego-image. This feature can be used to determine whether there exist hidden messages embedded with the F5 method. There are some other findings regarding the steganalysis of particularly targeted data hiding method Fridrich et al. (2002) and Chandramouli and Memon (2001). Lyu and Farid (2002) proposed a more general steganalysis method based on image high order statistics, derived from image decomposition with separable quadrature mirror filters. The wavelet highfrequency subbands’ high order statistics are extracted as features for steganalysis. It can differentiate stegoimages from cover images with a certain success rate. The data hiding methods addressed for the steganalysis in Lyu and Farid (2002) are basically the Least Significant Bit-plane (LSB) modification based steganographic tools. Sullivan et al. (2005) proposed a steganalysis method based on Markov model. The empirical transition matrix of a test image is formed. Because the size of the empirical transition matrix is very large, e.g., the 65536 elements for a grey level image with bit depth of 8, it cannot be used as features directly. Sullivan et al. (2005) select several largest probabilities along the main diagonal together with 4100 Res. J. App. Sci. Eng. Technol., 7(19): 4100-4105, 2014 their neighbours and randomly select some other probabilities along the main diagonal as features. It is obvious that some useful information might be ignored due to the random fashion of feature formulation. The data hiding methods addressed in Sullivan et al. (2005) are restricted to Spread Spectrum (SS) data hiding methods. Although it may not carry as many information bits as the LSB methods in general, the SS methods can still serve for the covert communication purpose. For example, a terrorist command may need only to send a ‘GO’ command to his cell members for an attack. By the way, some newly developed SS methods can hide a large amount of data. For instance, a data embedding rate from 0.5 bpp (bits per pixel) to 0.75 bpp has been achieved by Xuan et al. (2004). In addition, the SS methods are known more robust than the LSB. Therefore, it is necessary to consider the SS methods for steganalysis. Zou et al. (2006), proposed a steganalysis system based on Markov chain model of thresholded prediction-error image is proposed. Image pixels are predicted with the neighbouring pixels. The prediction error is obtained by subtracting the prediction values from the pixel value. Though the range of the difference values is increased, the majority of the difference values are highly concentrated in a small range near zero owing to the high correlation between neighbouring pixels in natural images. Considering the large values in the prediction-error image may mainly be caused by the image content rather than by the data hiding process, a certain threshold is applied to the prediction errors to remove the large values in the prediction error images for steganalysis, thus limiting the dynamic range of the prediction error image. The prediction-error images are modelled using Markov chain. Empirical transition matrix is calculated and served as features for steganalysis. Owing to the thresholding, the size of the empirical transition matrixes is decreased to a manageable size for classifiers so that all of the probabilities in the matrixes can be included into the feature vectors. For feature classification, the SVM with both linear and non-linear kernels are used as classifier. Discrete wavelet transform: Discrete Wavelet Transform (DWT) is a mathematical tool for hierarchically decomposing an image. Non-stationary signals can easily be handled using DWT. The entire transform is based on tiny waves, called wavelets. These wavelets vary with respect to frequency and limited duration. This transform yields both the spatial and frequency description of an image. During transformation, temporal information is maintained. Fig. 1: 3-level DWT The DWT splits the signal into high and low frequency parts. The high frequency part contains information about the edge components, while the low frequency part is split again into high and low frequency parts (Kundur and Hatzinakos, 1998). As shown in Fig. 1, initially we have a whole image. After first level of decomposition, the image is decomposed into four sub-bands namely LL 1 , LH 1 , HL 1 , HH 1 . To apply second level of decomposition, LL 1 is given as the first input and is followed by LH 1 , HL 1 , HH 1 . At the end of second level decomposition, LL 1 has got 4 sub-bands namely LL 2 , LH 2 , HL 2 , HH 2 . For third level of decomposition, initially LL 2 is decomposed into LL 3 , LH 3 , HL 3 , HH 3 . This is applied for all LL 1 , LH 1 , HL 1 , HH 1 . We chose to have three-level DWT because of its effective spatial localization and multi-resolution characteristics that matches the human visual system. When the level of DWT increased, performance level can be improved even more. METHODOLOGY Proposed steganalytic algorithm: Initially, we attempt to provide a knowledge base to the computer, by training a dataset to arrive at a model. In this study, we provided some ten images into the training dataset, which consists of both the normal and stego images. The stego images are the outcome of our steganographic algorithm, which aims to embed multiple images in a single cover medium, however without any quality loss. Secondly, we’ve a testing dataset with ten images for prediction, based on the model obtained in the training phase. This prediction of identifying whether the image is stego or normal is made possible by the training model. 4101 Res. J. App. Sci. Eng. Technol., 7(19): 4100-4105, 2014 The classification between stego and normal images is done by SVM (Support Vector Machine) classifier. Here, we focus on calculating the energy value, which forms the basis to identify between the normal and stego images. Initially, we applied the three-level DWT on all images of the training dataset. We chose to have threelevel DWT because of its efficiency as discussed in Section III. Then, the energy value is calculated as given in (1). Now, the same three-level DWT is applied on the image that needs to be tested. Both the training and testing feature value are fed into the training and testing phase respectively. The result is finally produced after SVM classification. SVM classification: The support vector machines are very powerful for two-class classification. SVM can handle not only linear case but also no linear case. The energy value is calculated by using Energy Formula: E= Accuracy = correctly predicted data/Total testing data×100 Implementation: • • • • • • • • • • 𝑁𝑁 ∑𝑀𝑀 𝑖𝑖=1 ∑𝑗𝑗 =1 𝑋𝑋 𝑖𝑖,𝑗𝑗 Apply three-level DWT for all training images Calculate the energy value and we treat this value as the feature value Save the feature value for the purpose of analysis Get the input image that needs to be analyzed Apply three-level DWT to the testing image Finally, calculate the energy value for all DWT sub bands Feed the training feature values to the training phase Give the testing feature value into the classification phase The result is produced after SVM classification If the image is normal, it is diagnosed as normal else it is detected as a stego image EXPERIMENTAL RESULTS AND ANALYSIS 𝑀𝑀∗𝑁𝑁 where, M = The total number of rows N =The total number of columns of an image In this section, experimental results and analysis are presented to demonstrate the accurate detection between the stego and normal image (Fig. 2 to 5). The accuracy rate in detecting between the normal and stego image is given by: Steganalysis: The stego image is obtained by embedding multiple images in a JPEG image with an Fig. 2: Home page 4102 Res. J. App. Sci. Eng. Technol., 7(19): 4100-4105, 2014 Fig. 3: Hiding several images in a single image Fig. 4: Image after embedding Fig. 5: Resultant image is found as extracted 1 Fig. 6: Training process 4103 Res. J. App. Sci. Eng. Technol., 7(19): 4100-4105, 2014 Fig. 7: Completion of training process algorithm (Fig. 6 to 10). The outcome of this method is a stego image with good quality. It is shown via the PSNR value in Fig. 11. Here, we compare a set of five images as presented in Table 1. Based on Table 1, Fig. 12 is presented and is shown below. Despite this, our steganalytic algorithm proves 90% accuracy in correct detection of stego/normal Fig. 8: Analyzing an image Fig. 9: Image analysis using SVM 4104 Res. J. App. Sci. Eng. Technol., 7(19): 4100-4105, 2014 CONCLUSION In this study, we present a steganalytic algorithm that detects the stego/normal image with 90% accuracy. The accuracy rate remains stable when different sets of images are tested. The stego images are obtained by a steganographic algorithm, whose PSNR value ranges in 51. SVM classifier is employed over here, to classify between the images. Also, this project can be extended to other transforms such as contourlet, Curvelet and wavelet lifting. This system limits itself in analyzing whether the image is normal or containing any secret information. In future, this system can be used to extend to extract the secret message also. In future, this system can be extended to videos too. Fig. 10: Classification between normal and stego 60 Existing system Proposed system 51.1428 51.1376 51.139 50 51.0653 51.1377 40 30 20 REFERENCES 10 0 1 2 3 4 5 Fig. 11: PSNR values of images are compared 1.0 0.9 Zhu Proposed 0.8 0.7 0.6 0.5 0.4 0.3 0.2 0.1 0 True positive False positive Rate detection correct Fig. 12: The proposed technique shows high correct detection rate Table 1: Comparison of PSNR values between existing and proposed technique Image name Zhu technique Proposed technique Source image 1 40.2143 51.1428 Source image 2 39.2532 51.1376 Source image 3 42.4721 51.1390 Source image 4 48.1428 51.0653 Source image 5 42.1653 51.1377 Table 2: Correct detection accuracy is given and is compared with the existing system Correct Techniques True positive False positive detection rate Zhu 0.6 0.4 80% Proposed 0.8 0.2 90% image, when compared to an existing technique ‘zhu’. The graph considers true and false positive attributes to show the correct detection as shown in Table 2. Table 2 is presented via graph in Fig. 3. Chandramouli, R. and N. Memon, 2001. Analysis of LSB based image steganography techniques. Proceeding of the International Conference on Image Processing, 3: 1019-1022. Fridrich, J., M. Goljan and R. Du, 2001. Detecting LSB steganography in color and gray-scale images. IEEE Multimedia, 8(4): 22-28. Fridrich, J., M. Goljan and D. Hogea, 2002. Steganalysis of JPEG Images: Breaking the F5 algorithm. Proceeding of the 5th International Workshop on Information Hiding, pp: 310-323. Kundur, D. and D. Hatzinakos, 1998. Digital watermarking using multiresolution wavelet decomposition. Proceedings of the IEEE International Conference on Acoustic, Speech, Signal Processing, 5: 2969-2972. Lyu, S. and H. Farid, 2002. Detecting hidden messages using higher-order statistics and support vector machines. Proceedings of the 5th International Workshop on Information Hiding. Noordwijkerhout, the Netherlands. Sullivan, K., K. Madhow, S. Chandrasekaran and B.S. Manjunath, 2005. Steganalysis of spread spectrum data hiding exploiting cover memory. Proceedings of the SPIE 2005, 5681: 38-46. Xuan, G., Y.Q. Shi and Z. Ni, 2004. Lossless data hiding using integer wavelet transform and spread spectrum. Proceedings of the IEEE International Workshop on Multimedia Signal Processing (MMSP04). Siena, Italy. Zou, D., Y.Q. Shi, S. Wei and X. Guorong, 2006. Steganalysis based on Markov model of thresholded prediction-error image. Proceeding of the IEEE International Conferences on Multimedia and Expo, pp: 1365-1368. 4105
