Basin-scale interpolation of Snow Water Equivalent using PRISM, SNOTEL and...
advertisement

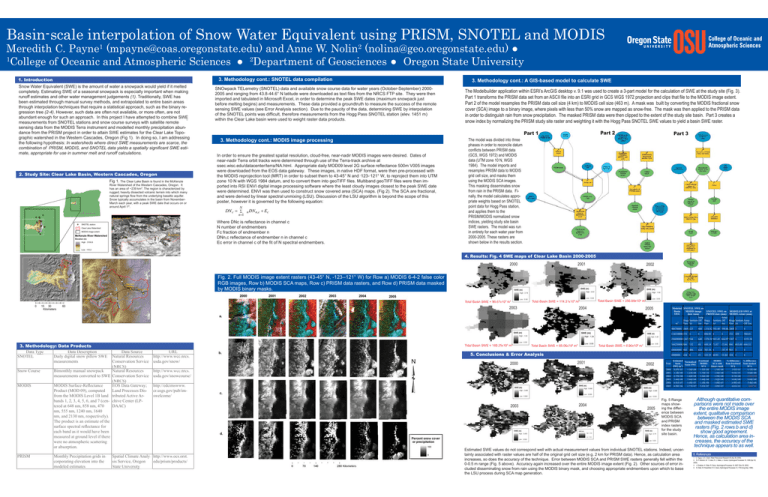
Basin-scale interpolation of Snow Water Equivalent using PRISM, SNOTEL and MODIS Meredith C. Payne1 (mpayne@coas.oregonstate.edu) and Anne W. Nolin2 (nolina@geo.oregonstate.edu) ● 1 College of Oceanic and Atmospheric Sciences ● 2Department of Geosciences ● Oregon State University 1. Introduction Snow Water Equivalent (SWE) is the amount of water a snowpack would yield if it melted completely. Estimating SWE of a seasonal snowpack is especially important when making runoff estimates and other water management judgements (1). Traditionally, SWE has been estimated through manual survey methods, and extrapolated to entire basin areas through interpolation techniques that require a statistical approach, such as the binary regression tree (2-4). However, such data are often not available, or more often, are not abundant enough for such an approach. In this project I have attempted to combine SWE measurements from SNOTEL stations and snow course surveys with satellite remote sensing data from the MODIS Terra instrument and modelled monthly precipitation abundance from the PRISM project in order to attain SWE estimates for the Clear Lake Topographic watershed in the Western Cascades, Oregon (Fig 1). In doing so, I am addressing the following hypothesis: In watersheds where direct SWE measurements are scarce, the combination of PRISM, MODIS, and SNOTEL data yields a spatially significant SWE estimate, appropriate for use in summer melt and runoff calculations. 2. Study Site: Clear Lake Basin, Western Cascades, Oregon Fig 1. The Clear Lake Basin is found in the McKenzie River Watershed of the Western Cascades, Oregon. It has an area of ~239 km2. The region is characterized by rugged, heavily dissected volcanic terrain into which many natural springs flow from the underlying basaltic aquifer. Snow typically accumulates in the basin from NovemberMarch each year, with a peak SWE date that occurs on or around April 1st. OREGON N Santiam Junction SNOTEL station Clear Lake Watershed MODIS image extent Hogg Pass McKenzie River Watershed Elevation (m) High : 3150.6 3. Methodology cont.: SNOTEL data compilation SNOwpack TELemetry (SNOTEL) data and available snow course data for water years (October-September) 20002005 and ranging from 43.8-44.6° N latitude were downloaded as text files from the NRCS FTP site. They were then imported and tabulated in Microsoft Excel, in order to determine the peak SWE dates (maximum snowpack just before melting begins) and measurements. These data provided a groundtruth to measure the success of the remote sensing SWE values (see Error Analysis section). Due to the paucity of the data, determining SWE by interpolation of the SNOTEL points was difficult, therefore measurements from the Hogg Pass SNOTEL station (elev. 1451 m) within the Clear Lake basin were used to weight raster data products. 3. Methodology cont.: A GIS-based model to calculate SWE The Modelbuilder application within ESRI’s ArcGIS desktop v. 9.1 was used to create a 3-part model for the calculation of SWE at the study site (Fig. 3). Part 1 transforms the PRISM data set from an ASCII file into an ESRI grid in GCS WGS 1972 projection and clips that file to the MODIS image extent. Part 2 of the model resamples the PRISM data cell size (4 km) to MODIS cell size (463 m). A mask was built by converting the MODIS fractional snow cover (SCA) image to a binary image, where pixels with less than 50% snow are mapped as snow-free. The mask was then applied to the PRISM data in order to distinguish rain from snow precipitation. The masked PRISM data were then clipped to the extent of the study site basin. Part 3 creates a snow index by normalizing the PRISM study site raster and weighting it with the Hogg Pass SNOTEL SWE values to yield a basin SWE raster. Part 2 Part 1 3. Methodology cont.: MODIS image processing In order to ensure the greatest spatial resolution, cloud-free, near-nadir MODIS images were desired. Dates of near-nadir Terra orbit tracks were determined through use of the Terra-track archive at ssec.wisc.edu/datacenter/terra/NA.html. Appropriate daily MOD09 level 2G surface reflectance 500m V005 images were downloaded from the EOS data gateway. These images, in native HDF format, were then pre-processed with the MODIS reprojection tool (MRT) in order to subset them to 43-45° N and -123--121° W, to reproject them into UTM zone 10 N with WGS 1984 datum, and to convert them into geoTIFF files. Multiband geoTIFF files were then imported into RSI ENVI digital image processing software where the least cloudy images closest to the peak SWE date were determined. ENVI was then used to construct snow covered area (SCA) maps. (Fig 2). The SCA are fractional, and were derived by linear spectral unmixing (LSU). Discussion of the LSU algorithm is beyond the scope of this poster, however it is governed by the following equation: DN c = N ∑ n =1 n DN n,c + Ec Where DNc is reflectance in channel c N number of endmembers Fc fraction of endmember n DNn,c reflectance of endmember n in channel c Ec error in channel c of the fit of N spectral endmembers. Part 3 The model was divided into three phases in order to reconcile datum conflicts between PRISM data (GCS, WGS 1972) and MODIS data (UTM zone 10 N, WGS 1984). The model imports and resamples PRISM data to MODIS grid cell size, and masks them using the MODIS SCA images. This masking disseminates snow from rain in the PRISM data. Finally, the model calculates appropriate weights based on SNOTEL point data for Hogg Pass station, and applies them to the PRISM/MODIS normalized snow indices, yielding study site basin SWE rasters. The model was run in entirety for each water year from 2000-2005. These rasters are shown below in the results section. Low : 110.2 4. Results: Fig. 4 SWE maps of Clear Lake Basin 2000-2005 2000 2001 2002 Fig. 2. Full MODIS image extent rasters (43-45° N, -123--121° W) for Row a) MODIS 6-4-2 false color RGB images, Row b) MODIS SCA maps, Row c) PRISM data rasters, and Row d) PRISM data masked by MODIS binary masks. 22 Santiam Junction Hogg Pass ( / 20 Jump Off Joe 0 15 30 Kilometers 3. Methodology: Data Products Data T Type yp Data Description p SNOTEL Daily digital snow pillow SWE measurements Snow Course MODIS PRISM Total Basin SWE = 90.67x10⁶ m3 126 60 Total Basin SWE = 166.25x10⁶ m3 Data Source Natural Resources Conservation Service ( (NRCS) ) Bimonthly manual snowpack Natural Resources measurements converted to SWE Conservation Service ( (NRCS) ) MODIS Surface-Reflectance EOS Data Gateway; Product (MOD 09), computed Land Processes Disfrom the MODIS Level 1B land tributed Active Arbands 1, 2, 3, 4, 5, 6, and 7 (cen- chive Center (LPtered at 648 nm, 858 nm, 470 DAAC) nm, 555 nm, 1240 nm, 1640 nm, and 2130 nm, respectively). The product is an estimate of the surface spectral reflectance for each band as it would have been measured at ground level if there were no atmospheric scattering or absorption. Monthly Precipitation grids incorporating elevation into the modeled estimates Total Basin SWE = 114.31x10⁶ m3 2003 URL http://www.wcc.nrcs. usda.gov/snow/ Total Basin SWE = 256.69x10⁶ m3 2004 Total Basin SWE = 68.06x10⁶ m3 2005 Total Basin SWE = 6.90x10⁶ m3 5. Conclusions & Error Analysis 2000 2001 2002 Year 2000 2001 2002 2003 2004 2005 http://www.wcc.nrcs. usda.gov/snowcourse/ http://edcimswww. cr.usgs.gov/pub/imswelcome/ Spatial Climate Analy- http://www.ocs.orst. sis Service, Oregon edu/prism/products/ State University y Modeled SNOTEL SWE on Basin MODIS image SNOTEL SWE on SWE date (mm) PRISM date (mm) Jump Jump Hogg Santiam Off Hogg Santiam Off Pass Jct Jct m3 Joe Pass Joe 2003 SNOTEL SWE on MODIS image SNOTEL SWE on PRISM date date (mm) (mm) MODELED SWE at MODIS extent (mm) 2004 2005 MODELED SWE at MODIS extent (mm) Hogg Santiam Jump Pass Jct Off Joe 90670000 1069 523 460 1154.82 393.40 390.86 1069 0 0 114310000 572 0 0 704.01 494.92 0 0 572 529 256690000 1367 544 640 1370.56 563.45 664.97 1367 0 166250000 686 132 89 68060000 803 406 424 705.58 0 197.97 803 0 0 6900000 25 55.84 224 0 0 224 8 Estimated Normalized basin basin SWE SWE (m3) 9.07E+07 1.26E+08 1.14E+08 1.23E+08 2.57E+08 1.42E+08 1.66E+08 1.66E+08 6.81E+07 5.48E+07 6.90E+06 2.77E+07 Fig. 5 Range maps showing the difference between MODIS SCA and PRISM index rasters for the study site basin. Estimated SWE values do not correspond well with actual measurement values from individual SNOTEL stations. Indeed, uncertainty associated with raster values are half of the original grid cell size (e.g. 2 km for PRISM data). Hence, as calculation area increases, so does the accuracy of the technique. Error between MODIS SCA and PRISM SWE rasters generally fell within the 0-0.5 m range (Fig. 5 above). Accuracy again increased over the entire MODIS image extent (Fig. 2). Other sources of error included disseminating snow from rain using the MODIS binary mask, and choosing appropriate endmembers upon which to base the LSU process during SCA map generation. 609.14 71.07 223.35 60.91 1253.38 22.84 686 683.49 666.51 Fractional MODIS % Difference MODIS SCA with from fractional SCA binary mask SCA 1.55E+08 1.34E+08 1.91E+01 1.73E+10 1.36E+08 9.93E+01 1.56E+08 1.39E+08 8.75E+00 1.84E+08 1.82E+08 9.64E+00 1.10E+08 5.80E+07 4.90E+01 5.33E+07 2.09E+07 4.81E+01 % Difference from masked SCA 6.33E+00 9.42E+00 2.65E+00 8.68E+00 5.46E+00 2.46E+01 Although quantitative comparisons were not made over the entire MODIS image extent, qualitative comparison between the MODIS SCA and masked estimated SWE rasters (Fig. 2 rows b and d) show good agreement. Hence, as calculation area increases, the accuracy of the technique appears to as well. 6. References 1. C. Tague, G. E. Grant, Water Resources Research 40 (Apr 28, 2004). 2. N. P. Molotch, M. T. Colee, R. C. Bales, J. Dozier, Hydrological Processes 19, 1459 (Apr 30, 2005). 3. J. Erxleben, K. Elder, R. Davis, Hydrological Processes 16, 3627 (Dec 30, 2002). 4. K. Elder, W. Rosenthal, R. E. Davis, Hydrological Processes 12, 1793 (Aug-Sep, 1998).


