DRAWING CONCLUSIONS 5
advertisement
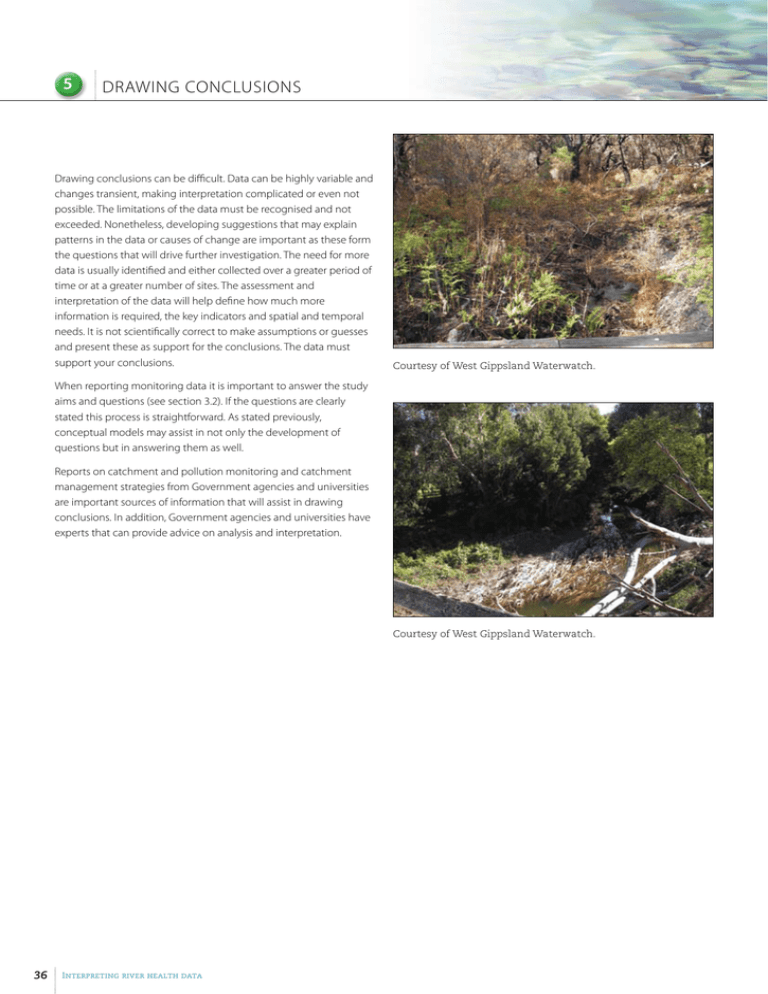
5 DRAWING CONCLUSIONS Drawing conclusions can be difficult. Data can be highly variable and changes transient, making interpretation complicated or even not possible. The limitations of the data must be recognised and not exceeded. Nonetheless, developing suggestions that may explain patterns in the data or causes of change are important as these form the questions that will drive further investigation. The need for more data is usually identified and either collected over a greater period of time or at a greater number of sites. The assessment and interpretation of the data will help define how much more information is required, the key indicators and spatial and temporal needs. It is not scientifically correct to make assumptions or guesses and present these as support for the conclusions. The data must support your conclusions. Courtesy of West Gippsland Waterwatch. When reporting monitoring data it is important to answer the study aims and questions (see section 3.2). If the questions are clearly stated this process is straightforward. As stated previously, conceptual models may assist in not only the development of questions but in answering them as well. Reports on catchment and pollution monitoring and catchment management strategies from Government agencies and universities are important sources of information that will assist in drawing conclusions. In addition, Government agencies and universities have experts that can provide advice on analysis and interpretation. Courtesy of West Gippsland Waterwatch. 36 Interpreting river health data 6 PRESENTING THE DATA The two most important considerations when presenting data are to be confident that the presentation relates to the questions being addressed and to keep within the limitations of the data. For example, if your question is “Has this site met SEPP (WoV) water quality objectives?” then you first need to have enough data to assess against SEPP (WoV) water quality objectives. Secondly, you should present the data in a table, possibly with values that trigger SEPP (WoV) highlighted, so the reader can see the results. You could also present results from previous years as a comparison. In this example it is not appropriate to use time series graphs to work out whether the site meets the objectives, as you can only determine approximate percentile values from a graph. When an issue is identified, it is best to state the issue first then assess possible causes. For example, summary statistics indicate that total phosphorus exceeds the water quality objective and therefore a risk of excessive algal growth exists. Once stated, an investigation into the magnitude of the problem, the likelihood that a risk exists and potential sources can be undertaken. An important point when presenting data is to keep it as simple as possible. Complicated graphs or tables may confuse readers, especially when too much data or information is included in one figure or table. In general, three major forms of data presentation are most appropriate for the purposes of community monitoring. These are: 1.Assessment against SEPP (WoV) - a table of objectives and results for sites or catchments. The results of previous years can be added for comparison with results of the current year. For example, Table 3.1 in section 3.3. 2.Temporal changes - time series for looking at changes at a site over time and for identifying specific events such as drought and floods. Be wary of ‘joining the dots.’ By drawing a line between two data points an assumption may be made that the line represents what would have been measured between the points, whereas this is not necessarily the situation. ‘Joining the dots’ helps to see the trajectory and patterns in the data, however, if there are only a few data points, it may be misleading. For example, Figure 3.6 in section 3.3. 3.Spatial changes - column graphs for downstream changes. Conveying the spatial context can be assisted by mapping the sampling sites, data and sources or potential sources of contamination. Column graphs are a useful way to present spatial changes. For example, Figure 3.9 in section 3.3. Avoid the use of statistical terms such as ‘average’, ‘significant’, or ‘correlated’ unless you have undertaken these analyses. For substitution of the above statistical terms, you can use non-statistical terms such as ‘typical’, ‘marked’, or ‘indicative of a positive relationship’ to indicate these sorts of relationships. Courtesy of West Gippsland Waterwatch. Interpreting river health data 37 7 SOURCES OF DATA AND EXPERT ADVICE The Department of Sustainability and Environment (DSE) manages the Victorian Water Quality Monitoring Network (VWQMN). Data stored on the Victorian Water Resources Data Warehouse can be accessed through: http://www.vicwaterdata.net/vicwaterdata/home.aspx Within DSE, Waterwatch can provide water quality and biological interpretation and reporting advice. Contact Waterwatch coordinators via the Waterwatch Victoria website http://www.vic.waterwatch.org.au/ Also within DSE is the Freshwater Ecology Research group at the Arthur Rylah Institute (ARI), who can provide aquatic ecology advice, particularly on fish ecology. For information on current Freshwater Ecology projects at ARI and contact details visit http://www.dse.vic. gov.au/DSE/nrenari.nsf/fid/0D9706C5D8D06EFECA2574EB001D582D Courtesy of West Gippsland Waterwatch. The Environment Protection Authority (EPA), Victoria has an extensive database of water quality and biological information for Victorian rivers. The EPA also has a significant number of publications on regional water quality, assessment methods and guidelines. The EPA has experts in water quality and biology who can be contacted for advice. Contact the EPA by phone on (03) 9695 2722 or request information through the web at: https://epanote2.epa.vic.gov. au/4A2565E60021FA61/requestinfogeneral?openform Catchment Management Authorities (CMAs) also have substantial data resources and water quality and environmental reports. Contact your local CMA. 38 North Central CMA Phone (03) 5448 7124 Mallee CMA Phone (03) 5051 4377 Wimmera CMA Phone (03) 5384 1544 Port Phillip & Western Port CMA Phone (03) 8781 7900 Corangamite CMA Phone (03) 5232 9100 Glenelg Hopkins CMA Phone (03) 5571 2526 West Gippsland CMA Phone 1300 094 262 East Gippsland CMA Phone (03) 5152 0600 North East CMA Phone (02) 6043 7600 Goulburn Broken CMA Phone (03) 5820 1100 Interpreting river health data Courtesy of West Gippsland Waterwatch. 8 FURTHER READING Water sampling and quality assurance Water chemistry Waterwatch Victoria Methods Manual http://www.vic.waterwatch. org.au/file/inform/Methods%20Manual%20June99.pdf Manahan, S.E. (2004). Environmental chemistry. 8th Edition. CRC Press, Boca Raton, Florida USA. Waterwatch Victoria Equipment Manual http://www.vic.waterwatch. org.au/file/inform/Equipment%20Manual%20April%2099.pdf Wetzel, R.G. (1983). Limnology: Lake and river ecosystems. Academic Press, London. Waterwatch Victoria Data Confidence Guidelines Macroinvertebrates http://www.vic.waterwatch.org.au/file/inform/dc_guidelines.pdf Environment Protection Authority Victoria (2003). Rapid bioassessment methodology for rivers and streams. Publication no. 604.1. EPA Victoria, Melbourne. Waterwatch Victoria annual QAQC program reports http://www.vic.waterwatch.org.au/monitoring-&-data/204/ Contact the relevant Regional Waterwatch Coordinator for Regional Data Confidence Plans and Regional Methods Manuals Water quality guidelines ANZECC & ARMCANZ (2000). Australian and New Zealand Guidelines for Fresh and Marine Water Quality. Australian and New Zealand Environment and Conservation Council, Canberra. Environment Protection Authority Victoria (2004). Risk based assessment of ecosystem protection in ambient waters. Publication no. 961. EPA Victoria, Melbourne. Human health including E. coli: Government of Victoria (2003). Variation to State Environment Protection Policy (Waters of Victoria). Victorian Government Printer, Australia. National Health and Medical Research Council (2004). Australian drinking water guidelines. NH&MRC, Canberra. National Health and Medical Research Council (2008). Australian Drinking Water Guidelines, NH&MRC, Canberra. Government of Victoria (2003). Variation to State Environment Protection Policy (Waters of Victoria). Victorian Government Printer, Australia. Freshwater ecology and pollution impacts Boulton A.J. and Brock M.A. (1999). Australian freshwater ecology processes and management. Gleneagles Publishing, Adelaide. Hellawell, J.M. (1986). Biological indicators of freshwater pollution and environmental management. Elsevier Applied Science Publications, London. Interpreting river health data 39 9 GLOSSARY Alkaline – pH greater than 7. Alkalinity – the ability of water to resist change in pH. Blackwater event – when low oxygen, organically rich waters enter a river from floodplain wetlands, backwaters or tributaries. Biochemical oxygen demand (BOD) – The oxygen demand associated with the microbial decomposition of organic material. Circum-neutral – when water has an approximately neutral pH i.e.7. Condensed phosphates – complex, tightly-bound inorganic phosphate compounds. Sometimes referred to as ‘polyphosphates’. Dissolved oxygen –oxygen dissolved in water. Usually measured in milligrams per litre (mg/L) but can also be presented as percent saturation (%sat). 40 Oxygen trough – when the consumption of dissolved oxygen by the aquatic biota exceeds the input of dissolved oxygen, leading to a lowering of oxygen concentrations. Pass/ Fail objectives – objectives derived to assess whether a site meets a required standard. Saturation – The point at which the amount of oxygen entering and leaving water is equal. The water contains 100% of the oxygen it should be able to hold. Snapshot monitoring – taking one-off samples of a water quality parameter at many sites within a region to gain a ‘snapshot’ of river condition in the area. Step-wise impact – An impact which occurs in discrete, punctuated steps rather than causing a steady gradual decline in condition. Eutrophication – the process in which a body of water becomes enriched in dissolved nutrients. Suspended particulate matter (SPM) – The quantity of matter, for example clay, silt, detritus and plankton, in the water. Nitrogen fixing – The process whereby bacteria turn atmospheric nitrogen into nitrogen compounds that can be taken up by plants. Suspended solids (SS) - The quantity of matter, for example clay, silt, detritus and plankton in the water. Organic phosphorus – Phosphorus molecules associated with a carbon-based molecule, as in plant or animal tissue. Trigger values – a value or objective that, when met, triggers or prompts further action. Orthophosphates – simple inorganic forms of phosphates that are the most readily available to plants. Turbidity – visible pollution due to suspended material in water causing a reduction in the transmission of light. Interpreting river health data

