SECTION 6
advertisement
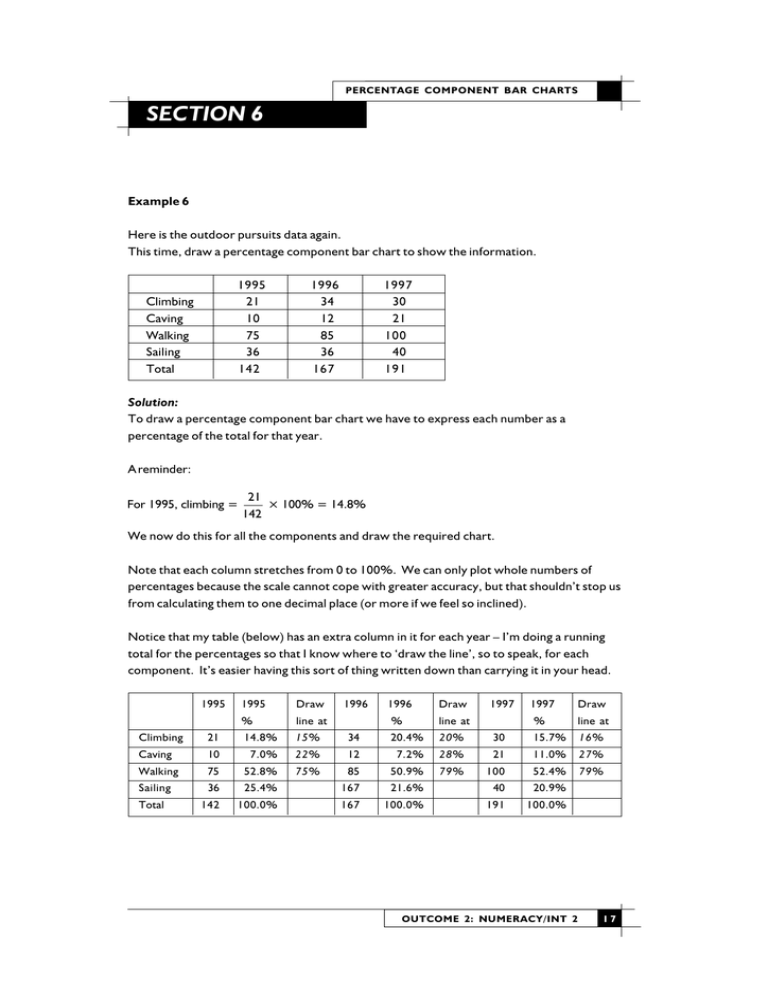
PERCENTAGE COMPONENT BAR CHARTS SECTION 6 Example 6 Here is the outdoor pursuits data again. This time, draw a percentage component bar chart to show the information. 1995 21 10 75 36 142 Climbing Caving Walking Sailing Total 1996 34 12 85 36 167 1997 30 21 100 40 191 Solution: To draw a percentage component bar chart we have to express each number as a percentage of the total for that year. A reminder: For 1995, climbing = 21 × 100% = 14.8% 142 We now do this for all the components and draw the required chart. Note that each column stretches from 0 to 100%. We can only plot whole numbers of percentages because the scale cannot cope with greater accuracy, but that shouldn’t stop us from calculating them to one decimal place (or more if we feel so inclined). Notice that my table (below) has an extra column in it for each year – I’m doing a running total for the percentages so that I know where to ‘draw the line’, so to speak, for each component. It’s easier having this sort of thing written down than carrying it in your head. 1995 1995 Draw % line at 1996 1996 Draw % line at 1997 1997 Draw % line at Climbing 21 14.8% 15% 34 20.4% 20% 30 15.7% 16% Caving 10 7.0% 22% 12 7.2% 28% 21 11.0% 27% Walking 75 52.8% 75% 85 50.9% 79% 100 52.4% 79% Sailing 36 25.4% 167 21.6% 40 20.9% Total 142 100.0% 167 100.0% 191 100.0% OUTCOME 2: NUMERACY/INT 2 17 PERCENTAGE COMPONENT BAR CHARTS The chart looks like this: Percentage Ac tiv ity Break down (J une) 100 90 80 70 60 50 40 30 20 10 0 C lim bing C av ing W alk ing Sailing 1995 1996 1997 Y ear This chart shows, for instance, that although the numbers of people sailing increased slightly (see the ordinary component chart on page 15, which shows the sailing component getting bigger), the percentage chart shows that the numbers of people sailing as a proportion (i.e. a percentage) of the total actually went down a bit. Sailing was not as popular in 1997, when compared with the other sports, as it was in 1995. This is where a percentage component chart scores, when you are looking for a comparison rather than an actual figure. ?6 Draw percentage component charts for the two questions in Exercise 5 on page 16. 18 OUTCOME 2: NUMERACY/INT 2
