Voxel-wise and Cluster-based Heritability Inferences of fMRI Data
advertisement

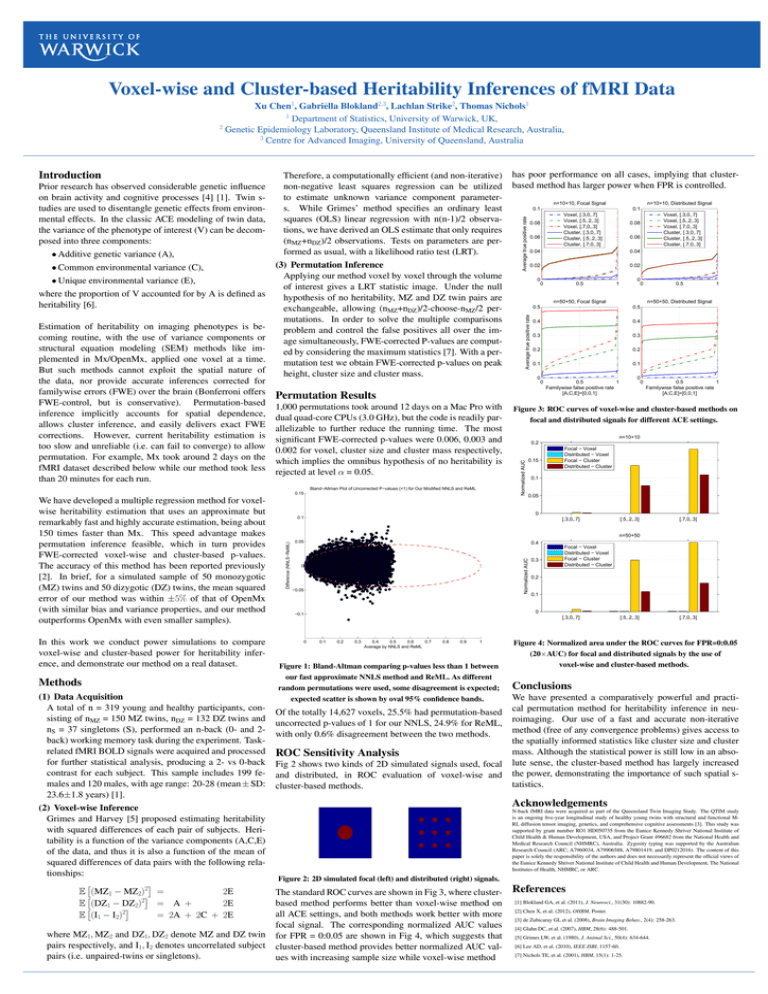
Voxel-wise and Cluster-based Heritability Inferences of fMRI Data Xu Chen1, Gabriëlla Blokland2,3, Lachlan Strike2, Thomas Nichols1 1 Department of Statistics, University of Warwick, UK, 2 Genetic Epidemiology Laboratory, Queensland Institute of Medical Research, Australia, 3 Centre for Advanced Imaging, University of Queensland, Australia • Common environmental variance (C), • Unique environmental variance (E), where the proportion of V accounted for by A is defined as heritability [6]. Estimation of heritability on imaging phenotypes is becoming routine, with the use of variance components or structural equation modeling (SEM) methods like implemented in Mx/OpenMx, applied one voxel at a time. But such methods cannot exploit the spatial nature of the data, nor provide accurate inferences corrected for familywise errors (FWE) over the brain (Bonferroni offers FWE-control, but is conservative). Permutation-based inference implicitly accounts for spatial dependence, allows cluster inference, and easily delivers exact FWE corrections. However, current heritability estimation is too slow and unreliable (i.e. can fail to converge) to allow permutation. For example, Mx took around 2 days on the fMRI dataset described below while our method took less than 20 minutes for each run. (3) Permutation Inference Applying our method voxel by voxel through the volume of interest gives a LRT statistic image. Under the null hypothesis of no heritability, MZ and DZ twin pairs are exchangeable, allowing (nMZ+nDZ)/2-choose-nMZ/2 permutations. In order to solve the multiple comparisons problem and control the false positives all over the image simultaneously, FWE-corrected P-values are computed by considering the maximum statistics [7]. With a permutation test we obtain FWE-corrected p-values on peak height, cluster size and cluster mass. 1,000 permutations took around 12 days on a Mac Pro with dual quad-core CPUs (3.0 GHz), but the code is readily parallelizable to further reduce the running time. The most significant FWE-corrected p-values were 0.006, 0.003 and 0.002 for voxel, cluster size and cluster mass respectively, which implies the omnibus hypothesis of no heritability is rejected at level α = 0.05. 0.15 In this work we conduct power simulations to compare voxel-wise and cluster-based power for heritability inference, and demonstrate our method on a real dataset. Methods (1) Data Acquisition A total of n = 319 young and healthy participants, consisting of nMZ = 150 MZ twins, nDZ = 132 DZ twins and nS = 37 singletons (S), performed an n-back (0- and 2back) working memory task during the experiment. Taskrelated fMRI BOLD signals were acquired and processed for further statistical analysis, producing a 2- vs 0-back contrast for each subject. This sample includes 199 females and 120 males, with age range: 20-28 (mean ± SD: 23.6±1.8 years) [1]. (2) Voxel-wise Inference Grimes and Harvey [5] proposed estimating heritability with squared differences of each pair of subjects. Heritability is a function of the variance components (A,C,E) of the data, and thus it is also a function of the mean of squared differences of data pairs with the following relationships: 2 E (MZ1 − MZ2) = 2E 2 E (DZ1 − DZ2) = A + 2E 2 E (I1 − I2) = 2A + 2C + 2E where MZ1, MZ2 and DZ1, DZ2 denote MZ and DZ twin pairs respectively, and I1, I2 denotes uncorrelated subject pairs (i.e. unpaired-twins or singletons). n=10+10, Distributed Signal 0.1 0.1 Voxel, [.3,0,.7] Voxel, [.5,.2,.3] Voxel, [.7,0,.3] Cluster, [.3,0,.7] Cluster, [.5,.2,.3] Cluster, [.7,0,.3] 0.08 0.06 0.06 0.04 0.02 0.02 0 0 0.5 Voxel, [.3,0,.7] Voxel, [.5,.2,.3] Voxel, [.7,0,.3] Cluster, [.3,0,.7] Cluster, [.5,.2,.3] Cluster, [.7,0,.3] 0.08 0.04 0 1 0 n=50+50, Focal Signal 0.5 0.4 0.4 0.3 0.3 0.2 0.2 0.1 0.1 0 0 0 0.5 1 n=50+50, Distributed Signal 0.5 Permutation Results Bland−Altman Plot of Uncorrected P−values (<1) for Our Modified NNLS and ReML 0.5 1 Familywise false positive rate [A,C,E]=[0,0,1] 0 0.5 1 Familywise false positive rate [A,C,E]=[0,0,1] Figure 3: ROC curves of voxel-wise and cluster-based methods on focal and distributed signals for different ACE settings. n=10+10 0.2 0.15 Focal − Voxel Distributed − Voxel Focal − Cluster Distributed − Cluster 0.1 0.05 0 0.1 [.3,0,.7] [.5,.2,.3] [.7,0,.3] n=50+50 0.05 0.4 Normalized AUC Difference (NNLS−ReML) We have developed a multiple regression method for voxelwise heritability estimation that uses an approximate but remarkably fast and highly accurate estimation, being about 150 times faster than Mx. This speed advantage makes permutation inference feasible, which in turn provides FWE-corrected voxel-wise and cluster-based p-values. The accuracy of this method has been reported previously [2]. In brief, for a simulated sample of 50 monozygotic (MZ) twins and 50 dizygotic (DZ) twins, the mean squared error of our method was within ±5% of that of OpenMx (with similar bias and variance properties, and our method outperforms OpenMx with even smaller samples). n=10+10, Focal Signal Average true positive rate • Additive genetic variance (A), has poor performance on all cases, implying that clusterbased method has larger power when FPR is controlled. Average true positive rate Prior research has observed considerable genetic influence on brain activity and cognitive processes [4] [1]. Twin studies are used to disentangle genetic effects from environmental effects. In the classic ACE modeling of twin data, the variance of the phenotype of interest (V) can be decomposed into three components: Therefore, a computationally efficient (and non-iterative) non-negative least squares regression can be utilized to estimate unknown variance component parameters. While Grimes’ method specifies an ordinary least squares (OLS) linear regression with n(n-1)/2 observations, we have derived an OLS estimate that only requires (nMZ+nDZ)/2 observations. Tests on parameters are performed as usual, with a likelihood ratio test (LRT). Normalized AUC Introduction 0 −0.05 0.3 Focal − Voxel Distributed − Voxel Focal − Cluster Distributed − Cluster 0.2 0.1 0 −0.1 [.3,0,.7] 0 0.1 0.2 0.3 0.4 0.5 0.6 0.7 Average by NNLS and ReML 0.8 0.9 1 Figure 1: Bland-Altman comparing p-values less than 1 between our fast approximate NNLS method and ReML. As different random permutations were used, some disagreement is expected; expected scatter is shown by oval 95% confidence bands. Of the totally 14,627 voxels, 25.5% had permutation-based uncorrected p-values of 1 for our NNLS, 24.9% for ReML, with only 0.6% disagreement between the two methods. ROC Sensitivity Analysis Fig 2 shows two kinds of 2D simulated signals used, focal and distributed, in ROC evaluation of voxel-wise and cluster-based methods. [.5,.2,.3] [.7,0,.3] Figure 4: Normalized area under the ROC curves for FPR=0:0.05 (20×AUC) for focal and distributed signals by the use of voxel-wise and cluster-based methods. Conclusions We have presented a comparatively powerful and practical permutation method for heritability inference in neuroimaging. Our use of a fast and accurate non-iterative method (free of any convergence problems) gives access to the spatially informed statistics like cluster size and cluster mass. Although the statistical power is still low in an absolute sense, the cluster-based method has largely increased the power, demonstrating the importance of such spatial statistics. Acknowledgements N-back fMRI data were acquired as part of the Queensland Twin Imaging Study. The QTIM study is an ongoing five-year longitudinal study of healthy young twins with structural and functional MRI, diffusion tensor imaging, genetics, and comprehensive cognitive assessments [3]. This study was supported by grant number RO1 HD050735 from the Eunice Kennedy Shriver National Institute of Child Health & Human Development, USA, and Project Grant 496682 from the National Health and Medical Research Council (NHMRC), Australia. Zygosity typing was supported by the Australian Research Council (ARC; A7960034, A79906588, A79801419, and DP0212016). The content of this paper is solely the responsibility of the authors and does not necessarily represent the official views of the Eunice Kennedy Shriver National Institute of Child Health and Human Development, The National Institutes of Health, NHMRC, or ARC. Figure 2: 2D simulated focal (left) and distributed (right) signals. The standard ROC curves are shown in Fig 3, where clusterbased method performs better than voxel-wise method on all ACE settings, and both methods work better with more focal signal. The corresponding normalized AUC values for FPR = 0:0.05 are shown in Fig 4, which suggests that cluster-based method provides better normalized AUC values with increasing sample size while voxel-wise method References [1] Blokland GA, et al. (2011), J. Neurosci., 31(30): 10882-90. [2] Chen X, et al. (2012), OHBM, Poster. [3] de Zubicaray GI, et al. (2008), Brain Imaging Behav., 2(4): 258-263. [4] Glahn DC, et al. (2007), HBM, 28(6): 488-501. [5] Grimes LW, et al. (1980), J. Animal Sci., 50(4): 634-644. [6] Lee AD, et al. (2010), IEEE ISBI, 1157-60. [7] Nichols TE, et al. (2001), HBM, 15(1): 1-25.


