Table 3
advertisement
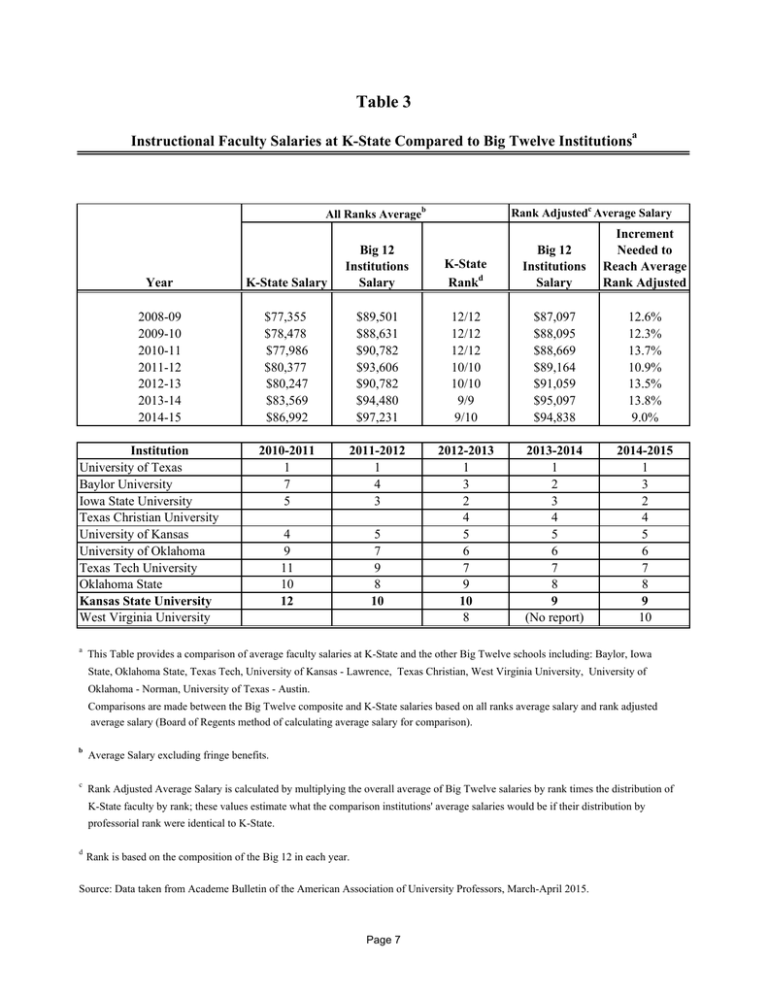
Table 3 Instructional Faculty Salaries at K-State Compared to Big Twelve Institutionsa Rank Adjustedc Average Salary All Ranks Averageb Increment Needed to Reach Average Rank Adjusted Year K-State Salary 2008-09 2009-10 2010-11 2011-12 2012-13 2013-14 2014-15 $77,355 $78,478 $77,986 $80,377 $80,247 $83,569 $86,992 $89,501 $88,631 $90,782 $93,606 $90,782 $94,480 $97,231 12/12 12/12 12/12 10/10 10/10 9/9 9/10 $87,097 $88,095 $88,669 $89,164 $91,059 $95,097 $94,838 12.6% 12.3% 13.7% 10.9% 13.5% 13.8% 9.0% 2010-2011 1 7 5 2011-2012 1 4 3 4 9 11 10 12 5 7 9 8 10 2012-2013 1 3 2 4 5 6 7 9 10 8 2013-2014 1 2 3 4 5 6 7 8 9 (No report) 2014-2015 1 3 2 4 5 6 7 8 9 10 Institution University of Texas Baylor University Iowa State University Texas Christian University University of Kansas University of Oklahoma Texas Tech University Oklahoma State Kansas State University West Virginia University a K-State Rankd Big 12 Institutions Salary Big 12 Institutions Salary This Table provides a comparison of average faculty salaries at K-State and the other Big Twelve schools including: Baylor, Iowa State, Oklahoma State, Texas Tech, University of Kansas - Lawrence, Texas Christian, West Virginia University, University of Oklahoma - Norman, University of Texas - Austin. Comparisons are made between the Big Twelve composite and K-State salaries based on all ranks average salary and rank adjusted average salary (Board of Regents method of calculating average salary for comparison). b Average Salary excluding fringe benefits. c Rank Adjusted Average Salary is calculated by multiplying the overall average of Big Twelve salaries by rank times the distribution of K-State faculty by rank; these values estimate what the comparison institutions' average salaries would be if their distribution by professorial rank were identical to K-State. d Rank is based on the composition of the Big 12 in each year. Source: Data taken from Academe Bulletin of the American Association of University Professors, March-April 2015. Page 7
