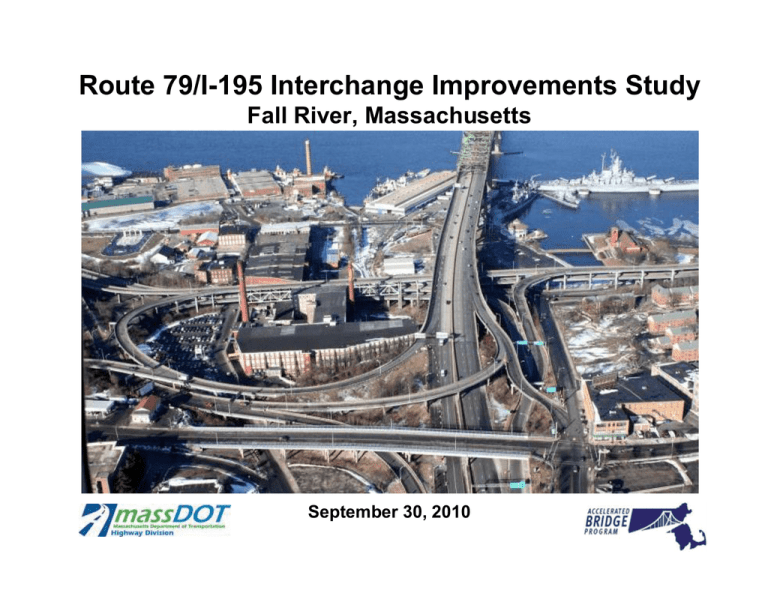
Route 79/I-195 Interchange Improvements Study Fall River, Massachusetts September 30, 2010
advertisement
Route 79/I-195 Interchange Improvements Study Fall River, Massachusetts September 30, 2010 Agenda 1. Refined interchange alternatives 2. Updates 3. Review of updated evaluation and key criteria 4. Proposed fall 2010 work plan and preliminary project construction schedule 5. Discussion of alternatives Major Steps for Rte. 79/I-95 Interchange Study and Project Currently Underway STEP 1 Value Engineering Study This study – required by FHWA – suggested investigating removing Rte. 79 Viaduct at the I-195 Interchange. April 2009 STEP 2 Feasibility Study Detailed review of Value Engineering Study to assess feasibility of removing Rte 79 Viaduct at the I-195 Interchange. July 2009 STEP 3 Planning – Alternatives Study The level of design at the end of this stage is “conceptual.” December 2009 – July 2010 STEP 4 State (MEPA) & Federal (NEPA) Environmental Review This more detailed engineering and environmental analysis will take about 12 months and the level of design will be between 5% and 10% complete. August 2010 – May 2011 STEP 5 STEP 6 Preliminary Engineering Final Design or Design/Build This marks the first intensive design stage. This step will take about 12-14 months and the design at the end will be 25% complete. This stage will take about 48 months. May 2011 – May 2012 Construction complete Fall of 2016 Proposed Rte. 79 Interchange Study Work Flow * 1 Project Initiation Kick-off meeting / Study area limits Communications / Task Force Members 2 Goals & Objectives Goals & Objectives / Evaluation Criteria Purpose & Need Statement 3 Existing Conditions Draft & Final Existing Conditions Summary 4 No Build Analysis Traffic / Socio-economic / Land Use 5 Alternative Development 6 Alternative Analysis 7 Report Recommendations 8 Prepare ENF Alternative Development / Screening of Alternatives Mobility / Safety / Environmental Socio-economic / Structures Final Report / Public Meeting Certificate from Secretary of EOEEA * Current stage Updates • Engineering Feasibility Report & IMR – Reviewed by Highway Division for general feasibility • Environmental Review Process – First focus is Massachusetts Environmental Notification Form to be filed late fall 2010 – Federal Environmental Assessment will follow Refined Interchange Alternatives Existing Traffic Volumes (Fall 2009 ADT) SB Viaduct < 5,000 5,000-10,000 10,000-15,000 Greater than 15,000 Volume per Day (weekday) Refinements: Alt. 1: Rte. 79 viaduct removed; 3 Rte. 79 signals New Street realigned Accommodate Anawan St. Br. improvements No impact to Mill Building No signal required Minimized impacts to stone arch bridge Key Issues: Alternative 1 2-way New Street? Impacts to stone arch bridge I-195 ramp to local street with 11% downgrade Refinements: Alt. 2: Rte. 79 NB & SB consolidated; NB level removed Local connection to I-95 via enhanced U-turn No impact to Mill Building Viaduct St. may be rebuilt & widened No signal required Key Issues: Alternative 2 I-195 ramp to local street with 11% downgrade Refinements: Alt. 3D: Rte. 79 viaduct removed; Rte. 79-Milliken Connector New signalized intersection + multiuse path No impact to Mill Building I-195 EB off-ramp changed Ramp L (Milliken to I-195 WB) removed I-195 WB on-ramp added I-195 on ramp improved Milliken impacts minimized Key Issues: Alternative 3D 2-way New St. ? Impacts to stone arch bridge I-195 ramp to local street with 11% downgrade Traffic Volume Intensity Shift Between Alt 1 & Alt 3 Alternative 1 Milliken Blvd Route 79 AM-PM Volume Intensity Old Alternative 3 New Alternative 3D AM-PM Volume Intensity AM-PM Volume Intensity Route 79 Milliken Blvd Route 79 Milliken Blvd +5000 - 5000 +5000 Connector Refinements Alt. 4: Rehabilitation Key Issues: Alternative 4 May not be possible to signalize Central + Anawan Comparison of Travel Times Minutes of Travel for Movements Indicated: year 2030, PM Peak Hour I-195 WB to Waterfront No-Build 2.7 Alt 1 1.5 1.7 Alt 2 Alt 3 1.5 Alt 4 3.2 Best Case Worst Case I-195 WB to Downtown 7.5 6.8 9.4 6.8 7.5 I-195 EB to Waterfront 4 1.9 3.3 2.6 3.6 I-195 EB to Downtown 1.9 1.9 1.9 2.7 1.9 Peak Periods Annual Time Savings (Hours) 0 -57,000 -31,000 -62,000 -63,000 Evaluating the Alternatives: Key Criteria 1. Safety: Improve interchange & local intersections 2. Mobility: Maintain regional connections, travel time, acceptable LOS at local intersections 3. Pedestrian/Bicycle: Improve access & circulation 4. Local Business: Improve access to waterfront & downtown 5. Environmental: Minimize impacts; enhance area 6. Local/Regional Goals: Consistent with City Master Plan & regional planning agency plans 7. Cost: Minimize future maintenance cost Key Criteria Transportation Criteria At Grade Viaduct Alt’s Alt’s 1 Safety Improves interchange merge/weave Improves local intersections Mobility Maintains regional connections Maintains regional local travel time Maintains regional regional travel time Acceptable LOS at local intersections Ped/Bike Improvements to & through study area Best Good Poor 3D 2 4 Key Criteria, continued Environmental Criteria At Grade Viaduct Alt’s Alt’s 1 Environmental Does not impact filled tidelands or require Ch. 91 waterways license Minimizes other environmental impacts Historic No probable harm to Amer. Printing Bldg. No probable harm to Central St. Bridge Reduces presence of hwy. in Hist. District Visual Improves visual quality of waterfront Best Good Poor 3D 2 4 Key Criteria, continued Local Goals Criteria At Grade Viaduct Alt’s Alt’s 1 Local Business 3D 2 4 Improves access to waterfront and downtown Minimize business impacts Local/Reg Consistent with Fall River Master Plans Plan Consistent with reg. planning agency Cost Minimizes future maintenance needs 143 m 136 m 197 m Construction cost ($ millions) Best Good Poor 151 m Proposed Fall 2010 Work Plan • Resolve key issues • Identify project to present in state ENF – Dec. 1 • File ENF for agency and public review – Dec. 31 • Public MEPA consultation meeting – January 2011 • Public comment period in January 2011 Discussion and Next Steps • Review: Draft Purpose and Need for the project – Address structural deficiencies; address safety problems; maintain acceptable levels of service in the local and regional project area; benefit existing historic, cultural, and recreation facilities; and reduce maintenance costs while remaining consistent with local, regional, and statewide transportation plans. – Need is demonstrated by the poor condition of the viaduct, substandard geometrics, and the number of bridges classified as structurally deficient. – Goals include: • Improve visual appearance of waterfront • Minimize negative local business and commercial impacts (during and post-construction) • Revitalize the waterfront • Enhance access to the downtown • Minimize business relocations and property takings • How well do the alternatives address the Purpose and Need Statement? Discussion Questions
