What Classes Are Seniors Taking?
advertisement

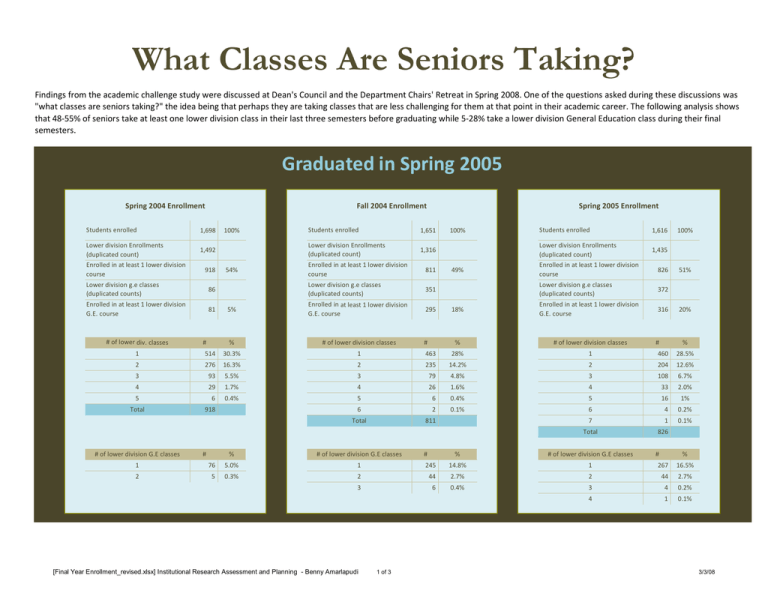
What Classes Are Seniors Taking? Findings from the academic challenge study were discussed at Dean's Council and the Department Chairs' Retreat in Spring 2008. One of the questions asked during these discussions was "what classes are seniors taking?" the idea being that perhaps they are taking classes that are less challenging for them at that point in their academic career. The following analysis shows that 48‐55% of seniors take at least one lower division class in their last three semesters before graduating while 5‐28% take a lower division General Education class during their final semesters. Graduated in Spring 2005 Spring 2004 Enrollment Students enrolled Lower division Enrollments (duplicated count) 1,698 100% Students enrolled 1,492 Lower division Enrollments (duplicated count) Enrolled in at least 1 lower division 918 course Lower division g.e classes (duplicated counts) 54% 1,651 5% Spring 2005 Enrollment 100% 1,316 Enrolled in at least 1 lower division 811 course Lower division g.e classes (duplicated counts) 86 Enrolled in at least 1 lower division 81 G.E. course # of lower div. classes Fall 2004 Enrollment 49% 1,616 Lower division Enrollments (duplicated count) 1,435 Enrolled in at least 1 lower division 826 course Lower division g.e classes (duplicated counts) 351 Enrolled in at least 1 lower division 295 G.E. course Students enrolled 18% 100% 51% 372 Enrolled in at least 1 lower division 316 G.E. course 20% # of lower division classes # % # of lower division classes 1 514 30.3% 1 463 28% 1 460 28.5% 2 276 16.3% 2 235 14.2% 2 204 12.6% 3 93 5.5% 3 79 4.8% 3 108 6.7% 4 29 1.7% 4 26 1.6% 4 33 2.0% 5 6 0.4% Total 918 # % # % 5 6 0.4% 5 16 1% 6 2 0.1% 6 4 0.2% Total 811 7 1 0.1% Total 826 # of lower division G.E classes # % # of lower division G.E classes # % # of lower division G.E classes 1 76 5.0% 1 245 14.8% 1 2 5 0.3% 2 44 2.7% 2 44 2.7% 3 6 0.4% 3 4 0.2% 4 1 0.1% [Final Year Enrollment_revised.xlsx] Institutional Research Assessment and Planning - Benny Amarlapudi 1 of 3 # % 267 16.5% 3/3/08 What Classes Seniors Are Taking? Graduated in Spring 2006 Spring 2005 Enrollment Students enrolled Lower division Enrollments (duplicated count) 1,947 100% Students enrolled 1,819 Lower division Enrollments (duplicated count) Enrolled in at least 1 lower division 1,073 course Lower division g.e classes (duplicated counts) Fall 2005 Enrollment 55% 22% 100% 1,562 Enrolled in at least 1 lower division 975 course Lower division g.e classes (duplicated counts) 530 Enrolled in at least 1 lower division 438 G.E. course 1,941 Spring 2006 Enrollment 50% 1,863 Lower division Enrollments (duplicated count) 1,619 Enrolled in at least 1 lower division 919 course Lower division g.e classes (duplicated counts) 625 Enrolled in at least 1 lower division 493 G.E. course Students enrolled 25% 100% 49% 600 Enrolled in at least 1 lower division 478 G.E. course 26% # of lower division classes # % # of lower division classes 1 584 30.0% 1 586 30.2% 1 478 25.7% 2 305 15.7% 2 250 12.9% 2 262 14.1% 3 125 6.4% 3 94 4.8% 3 122 6.5% 4 47 2.4% 4 34 1.8% 4 38 2.0% 5 10 0.5% 5 9 0.5% 5 15 0.8% 6 2 0.1% 6 1 0.1% 6 4 0.2% Total 1,073 7 1 0.1% Total 919 Total 975 # of lower division classes # % # % # of lower division G.E classes # % # of lower division G.E classes 1 357 18.3% 1 389 20.0% 1 380 20.4% 2 72 3.7% 2 81 4.2% 2 80 3 7 0.4% 3 18 0.9% 3 13 0.7% 4 2 0.1% 4 5 0.3% 4 4 0.2% 5 1 0.1% # of lower division G.E classes # % [Final Year Enrollment_revised.xlsx] Institutional Research Assessment and Planning - Benny Amarlapudi 2 of 3 # % 4.3% 3/3/08 What Classes Seniors Are Taking? Graduated in Spring 2007 Spring 2006 Enrollment Students enrolled Lower division Enrollments (duplicated count) 1,921 100% Students enrolled 1,735 Lower division Enrollments (duplicated count) Enrolled in at least 1 lower division 1,044 course Lower division g.e classes (duplicated counts) 54% 1,901 28% Spring 2007 Enrollment 100% 1,448 Enrolled in at least 1 lower division 906 course Lower division g.e classes (duplicated counts) 679 Enrolled in at least 1 lower division 532 G.E. course # of lower division classes Fall 2006 Enrollment 48% 1,860 Lower division Enrollments (duplicated count) 1,513 Enrolled in at least 1 lower division 903 course Lower division g.e classes (duplicated counts) 568 Enrolled in at least 1 lower division 450 G.E. course Students enrolled 24% 100% 49% 569 Enrolled in at least 1 lower division 439 G.E. course 24% # of lower division classes # % # of lower division classes 1 591 32.0% 1 532 28.0% 1 509 26.0% 2 286 15.0% 2 245 13.0% 2 249 13.0% 3 110 6.0% 3 99 5.0% 3 93 5.0% 4 47 3.0% 4 22 1.0% 4 37 2.0% # % # % 5 6 0.3% 5 7 0.3% 5 11 1.0% 6 4 0.2% 6 1 0.1% 6 4 0.2% Total 1,044 Total 906 Total 903 # of lower division G.E classes # of lower division G.E classes # % # of lower division G.E classes 1 420 22.0% 1 347 18.0% 1 335 18.0% 2 83 4.0% 2 89 5.0% 2 85 3 24 1.0% 3 13 1.0% 3 12 1.0% 4 4 0.2% 4 1 0.1% 4 7 0.4% 5 1 0.1% # % [Final Year Enrollment_revised.xlsx] Institutional Research Assessment and Planning - Benny Amarlapudi 3 of 3 # % 5.0% 3/3/08

