Exam in Multivariate Statistical Methods, 2015-01-09
advertisement
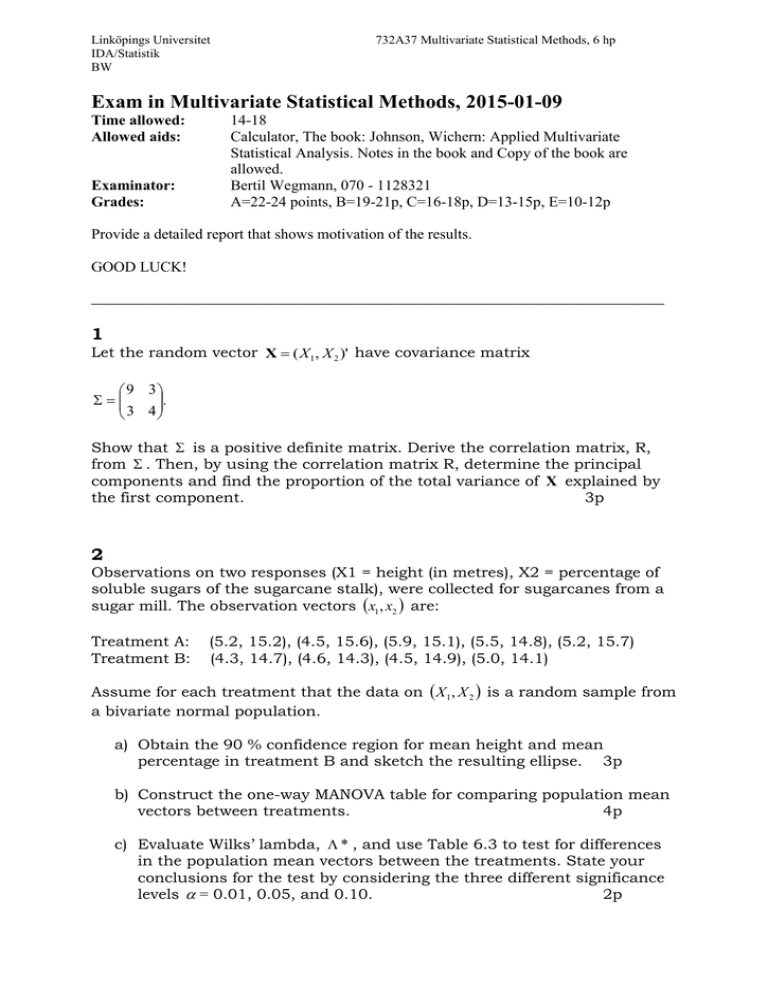
Linköpings Universitet IDA/Statistik BW 732A37 Multivariate Statistical Methods, 6 hp Exam in Multivariate Statistical Methods, 2015-01-09 Time allowed: Allowed aids: Examinator: Grades: 14-18 Calculator, The book: Johnson, Wichern: Applied Multivariate Statistical Analysis. Notes in the book and Copy of the book are allowed. Bertil Wegmann, 070 - 1128321 A=22-24 points, B=19-21p, C=16-18p, D=13-15p, E=10-12p Provide a detailed report that shows motivation of the results. GOOD LUCK! _________________________________________________________________________________________ 1 Let the random vector X ( X1, X 2 )' have covariance matrix 9 3 . 3 4 Show that is a positive definite matrix. Derive the correlation matrix, R, from . Then, by using the correlation matrix R, determine the principal components and find the proportion of the total variance of X explained by the first component. 3p 2 Observations on two responses (X1 = height (in metres), X2 = percentage of soluble sugars of the sugarcane stalk), were collected for sugarcanes from a sugar mill. The observation vectors x1 , x2 are: Treatment A: Treatment B: (5.2, 15.2), (4.5, 15.6), (5.9, 15.1), (5.5, 14.8), (5.2, 15.7) (4.3, 14.7), (4.6, 14.3), (4.5, 14.9), (5.0, 14.1) Assume for each treatment that the data on X1, X 2 is a random sample from a bivariate normal population. a) Obtain the 90 % confidence region for mean height and mean percentage in treatment B and sketch the resulting ellipse. 3p b) Construct the one-way MANOVA table for comparing population mean vectors between treatments. 4p c) Evaluate Wilks’ lambda, * , and use Table 6.3 to test for differences in the population mean vectors between the treatments. State your conclusions for the test by considering the three different significance levels = 0.01, 0.05, and 0.10. 2p 3 Let X be distributed as 𝑁3 (𝝁, 𝚺) where 𝛍′ = [3, − 2, 0] and 5 0 −3 Σ=( 0 9 0 ) −3 0 2 a) Are X 2 and 2 X 1 X 3 independent? Explain. b) Find the distribution of X 1 3X 3 2X1 X 2 1p 1.5p c) Find the conditional distribution of X 3 , given that X 1 2 and X 2 3 . 1.5p 4 In a study of poverty, crime, and deterrence, the sample correlation matrix below is shown for certain summary crime statistics: | R12 R11 𝐑 = ( − − − | − − −) R21 | R22 1.0 0.6 0.6 1.0 = −−− −−− −0.1 −0.2 −0.1 ( −0.3 | −0.1 | −0.2 | −−− | 1.0 | −0.3 −0.3 −0.1 −−− −0.3 1.0 ) The variables are X 1(1) nonprimary homicides X 2(1) primary homicides X 1( 2 ) severity of punishment X 2( 2 ) certainty of punishment Find the first sample canonical variate pair, (U 1 ,V1 ) , and their sample canonical correlation. 4p 5 In one part of a study, a factor analysis of accounting profit measures and market estimates of economic profits was performed by using a sample correlation matrix. This resulted in the following rotated principal component estimates of factor loadings for an m=3 factor model: Estimated factor loadings Variable Historical return on assets Historical return on equity Historical return on sales Replacement return on assets Replacement return on equity Replacement return on sales Market Q ratio Market relative excess value F1 F2 F3 0.43 0.13 0.30 0.41 0.20 0.33 0.93 0.91 0.61 0.89 0.24 0.71 0.90 0.41 0.16 0.08 0.50 0.23 0.89 0.48 0.28 0.79 0.29 0.36 a) Using the estimated factor loadings, determine the specific variances and communalities for the first six variables and interpret your results. 3p b) Using the estimated factor loadings, determine the proportion of total sample variance due to the first factor. 1p
