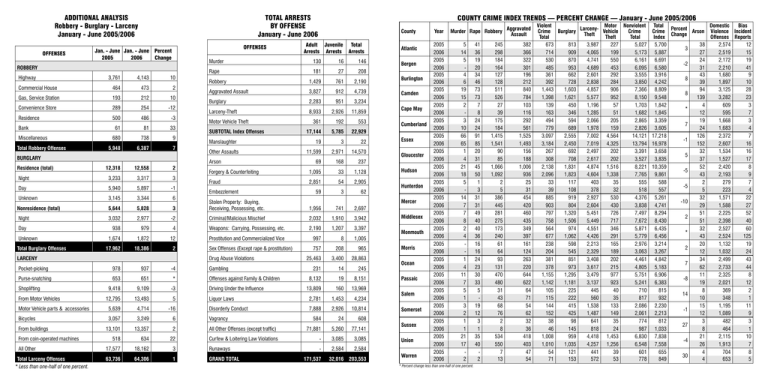
TOTAL ARRESTS BY OFFENSE January - June 2006
advertisement

ADDITIONAL ANALYSIS Robbery - Burglary - Larceny January - June 2005/2006 OFFENSES TOTAL ARRESTS BY OFFENSE January - June 2006 OFFENSES Jan. - June Jan. - June Percent 2005 2006 Change ROBBERY Highway 3,761 4,143 10 Commercial House 464 473 2 Gas, Service Station 193 212 10 Convenience Store 289 254 -12 Residence 500 486 -3 61 81 33 680 738 9 5,948 6,387 7 Bank Miscellaneous Total Robbery Offenses BURGLARY Residence (total) COUNTY CRIME INDEX TRENDS — PERCENT CHANGE — January - June 2005/2006 County Adult Juvenile Arrests Arrests Total Arrests Murder 130 16 146 Rape 181 27 208 Robbery 1,429 761 2,190 Aggravated Assault 3,827 912 4,739 Burglary 2,283 951 3,234 Larceny-Theft 8,933 2,926 11,859 361 192 553 17,144 5,785 22,929 19 3 22 11,599 2,971 14,570 69 168 237 Forgery & Counterfeiting 1,095 33 1,128 Fraud 2,851 54 2,905 59 3 62 Motor Vehicle Theft SUBTOTAL Index Offenses Manslaughter Other Assaults Arson 12,318 12,558 2 Night 3,233 3,317 3 Day 5,940 5,897 -1 Unknown 3,145 3,344 6 Nonresidence (total) 5,644 5,828 3 Stolen Property: Buying, Receiving, Possessing, etc. 1,956 741 2,697 Night 3,032 2,977 -2 Criminal/Malicious Mischief 2,032 1,910 3,942 938 979 4 Weapons: Carrying, Possessing, etc. 2,190 1,207 3,397 1,674 1,872 12 Prostitution and Commercialized Vice 997 8 1,005 17,962 18,386 2 Sex Offenses (Except rape & prostitution) 757 208 965 25,463 3,400 28,863 231 14 245 8,132 19 8,151 13,809 160 13,969 Liquor Laws 2,781 1,453 4,234 Disorderly Conduct 7,888 2,926 10,814 584 24 608 71,881 5,260 77,141 Day Unknown Total Burglary Offenses LARCENY Embezzlement Drug Abuse Violations 978 937 -4 Purse-snatching 653 651 * 9,418 9,109 -3 12,795 13,493 5 Motor Vehicle parts & jaccessories 5,639 4,714 -16 Bicycles 3,057 3,249 6 Vagrancy 13,101 13,357 2 All Other Offenses (except traffic) 518 634 22 Curfew & Loitering Law Violations - 3,085 3,085 17,577 18,162 3 Runaways - 2,584 2,584 63,736 64,306 1 GRAND TOTAL Shoplifting From Motor Vehicles From buildings From coin-operated machines All Other Total Larceny Offenses * Less than one-half of one percent. Offenses against Family & Children Driving Under the Influence Bergen Burlington Camden Cape May Cumberland Essex Gloucester Hudson Hunterdon Mercer Pocket-picking Gambling Atlantic 171,537 32,016 203,553 Middlesex Monmouth Morris Ocean Passaic Salem Somerset Sussex Union Warren Year 2005 2006 2005 2006 2005 2006 2005 2006 2005 2006 2005 2006 2005 2006 2005 2006 2005 2006 2005 2006 2005 2006 2005 2006 2005 2006 2005 2006 2005 2006 2005 2006 2005 2006 2005 2006 2005 2006 2005 2006 2005 2006 Murder Rape Robbery 5 14 5 4 6 19 15 2 3 10 66 65 1 4 21 18 5 14 7 7 8 2 4 1 4 11 7 5 1 3 2 1 1 21 17 2 * Percent change less than one-half of one percent. 41 36 19 20 34 46 73 73 7 8 24 24 91 85 20 31 45 50 1 3 31 31 49 40 40 36 16 16 24 23 30 33 5 19 12 3 1 35 40 2 245 298 184 164 127 128 511 526 27 39 175 184 1,415 1,541 90 85 1,066 1,092 2 5 386 445 281 275 173 240 61 64 93 131 470 480 31 43 68 76 2 8 534 550 7 13 Aggravated Assault 382 366 322 301 196 212 840 784 103 116 292 561 1,525 1,493 156 188 1,006 936 25 31 454 420 460 435 349 397 161 124 263 220 644 622 64 71 54 62 32 36 418 403 47 54 Violent Motor Nonviolent Total Domestic Bias LarcenyPercent Crime Burglary Vehicle Crime Crime Arson Violence Incident Theft Change Total Theft Total Index Offenses Reports 673 813 3,987 227 5,027 5,700 38 2,574 12 3 714 909 4,065 199 5,173 5,887 27 2,519 15 530 870 4,741 550 6,161 6,691 24 2,172 19 -2 485 953 4,689 453 6,095 6,580 31 2,210 41 361 662 2,601 292 3,555 3,916 43 1,680 9 8 392 728 2,838 284 3,850 4,242 39 1,897 10 1,443 1,603 4,857 906 7,366 8,809 94 3,125 28 8 1,398 1,621 5,577 952 8,150 9,548 139 3,282 23 139 450 1,196 57 1,703 1,842 4 609 3 * 163 346 1,285 51 1,682 1,845 12 595 7 494 594 2,066 205 2,865 3,359 19 1,668 3 7 779 689 1,978 159 2,826 3,605 24 1,683 4 3,097 2,555 7,002 4,564 14,121 17,218 126 2,372 7 -1 3,184 2,450 7,019 4,325 13,794 16,978 152 2,607 16 267 692 2,497 202 3,391 3,658 32 1,534 16 5 308 708 2,617 202 3,527 3,835 37 1,527 17 2,138 1,831 4,874 1,516 8,221 10,359 52 2,420 8 -5 2,096 1,823 4,604 1,338 7,765 9,861 43 2,193 9 33 117 403 35 555 588 2 279 7 -5 39 108 378 32 518 557 5 223 4 885 919 2,927 530 4,376 5,261 32 1,571 22 -10 903 804 2,604 430 3,838 4,741 29 1,588 27 797 1,320 5,451 726 7,497 8,294 51 2,225 52 2 758 1,506 5,449 717 7,672 8,430 51 2,398 40 564 974 4,551 346 5,871 6,435 32 2,527 60 * 677 1,062 4,426 291 5,779 6,456 43 2,524 125 238 598 2,213 165 2,976 3,214 20 1,132 19 2 204 545 2,329 189 3,063 3,267 12 1,032 24 381 851 3,408 202 4,461 4,842 34 2,499 43 7 378 973 3,617 215 4,805 5,183 62 2,733 44 1,155 1,295 3,479 977 5,751 6,906 11 2,325 8 -8 1,142 1,181 3,137 923 5,241 6,383 19 2,021 12 105 225 445 40 710 815 8 369 2 14 115 222 560 35 817 932 10 348 1 144 415 1,538 133 2,086 2,230 15 1,195 11 -1 152 425 1,487 149 2,061 2,213 12 1,089 9 38 98 641 35 774 812 3 482 3 27 46 145 818 24 987 1,033 8 464 1 1,008 959 4,418 1,453 6,830 7,838 21 2,115 10 -4 1,010 1,035 4,257 1,256 6,548 7,558 26 1,913 7 54 121 441 39 601 655 4 704 8 30 71 153 572 53 778 849 4 653 5 10 8,902 8,109 3 8,175 393 1,772 STATE OF NEW JERSEY - CRIME INDEX TRENDS January - June Percent Change 2005/2006 Offenses known to police: 504 727 6,010 7,407 421 1,604 530 702 5,382 175 11 2006 37 125 42 5 2005 Rural * Percent change is less than one-half of one percent. 37,067 34,183 2,221 6,173 17 2006 197 976 1,694 2,884 25,789 35,832 33,164 2,178 5,913 2,668 21 Suburban 2005 226 803 1,618 25,073 64,014 52,611 9,663 32,507 10,441 11,403 5,634 157 2006 376 5,236 10,445 11,174 5,020 170 339 Statistics presented here were gathered under the Uniform Crime Reporting Program of New Jersey and were submitted by all law enforcement agencies within the state. Attempts at comparison of resulting crime figures should not be made without first considering the individual crime factors that exist in each county. The New Jersey Crime Index increased less than one-half of one percent for the six-month period January through June 2006, compared with January through June 2005. The violent crime category, which consists of Murder, Rape, Robbery and Aggravated Assault, increased 3 percent, while the nonviolent crime group consisting of Burglary, Larceny-Theft and Motor Vehicle Theft increased less than one-half of one percent. Individual increases in violent crime were recorded as follows: Rape, less than one-half of one percent; Robbery 7 percent; and Aggravated Assault, 1 percent. Murder decreased 6 percent. In the non-violent crime category, increases were recorded as follows; Burglary, 2 percent and Larceny-Theft, 1 percent. Motor Vehicle Theft decreased 7 percent. Arson increased 18 percent. The number of Domestic Violence offenses decreased less than one-half of one percent, and the number of reported Bias Incident offenses increased 26 percent. Recorded below are the individual crime volumes and percent changes for this six-month period. Index Offenses 2005 Urban NEW JERSEY UNIFORM CRIME REPORTING (January - June 2005/2006) 5,645 33,281 10,601 54,327 65,501 -2 Percent Change Total Crime Index Nonviolent Crime Total Motor Vehicle Theft Violent Crime Burglary LarcenyTheft Total Year Murder Rape Robbery Aggravated Assault Character Nonviolent Crime Violent Crime URBAN - SUBURBAN - RURAL CRIMES The individual offenses for each of the areas are listed below. CRIME INDEX TRENDS - PERCENT CHANGE January - June 2005/2006 Issued by the State of New Jersey Office of the Attorney General Department of Law & Public Safety Stuart Rabner, Attorney General Col. Joseph R. Fuentes, Superintendent, New Jersey State Police State of New Jersey Department of Law & Public Safety Division of State Police (Uniform Crime Reporting Unit) Post Office Box 7068 West Trenton, New Jersey 08628-0068 Issued by the State of New Jersey Office of the Attorney General Dept. of Law & Public Safety Stuart Rabner, Attorney General Col. Joseph R. Fuentes Superintendent, New Jersey State Police Murder Rape Robbery Aggravated Assault Burglary Larceny-Theft Motor Vehicle Theft Total Crime Index Violent Crime Nonviolent Crime Arson Domestic Violence Bias Incidents Jan. - June 2005 196 607 5,948 7,793 17,962 63,736 13,200 109,442 14,544 94,898 665 35,577 350 Jan. - June 2006 185 610 6,387 7,832 18,386 64,306 12,277 109,983 15,014 94,969 785 35,499 441 Percent Change -6 * 7 1 2 1 -7 * 3 * 18 * 26 * Less than one-half of one percent. Prepared by the Uniform Crime Reporting Unit, New Jersey State Police, in conjunction with the Advisory Representative on Uniform Crime Reporting, New Jersey State Chiefs of Police Association. All 2006 crime figures from reporting units are preliminary. Final figures are published in the Annual Report.


