Access 2 Science LO2 Investigation Part 2 Years Deaths to
advertisement
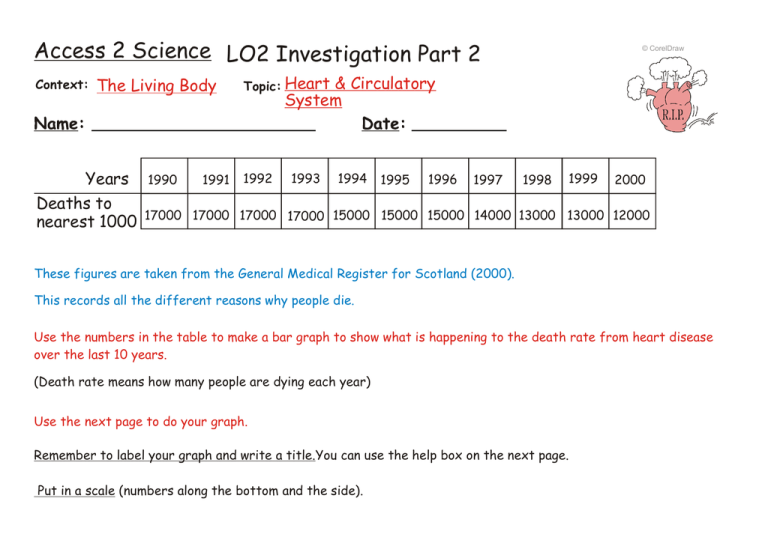
Access 2 Science LO2 Investigation Part 2 Context: The Living Body Years Deaths to nearest 1000 1990 1991 © CorelDraw Topic: Heart & Circulatory System 1992 1993 1994 1995 1996 1997 1998 1999 2000 17000 17000 17000 17000 15000 15000 15000 14000 13000 13000 12000 These figures are taken from the General Medical Register for Scotland (2000). This records all the different reasons why people die. Use the numbers in the table to make a bar graph to show what is happening to the death rate from heart disease over the last 10 years. (Death rate means how many people are dying each year) Use the next page to do your graph. Remember to label your graph and write a title.You can use the help box on the next page. Put in a scale (numbers along the bottom and the side). © CorelDraw Years Number of deaths (to the nearest 1000) Deaths in Scotland from heart disease Teachers Initials

