Rapid report of low CO 2
advertisement
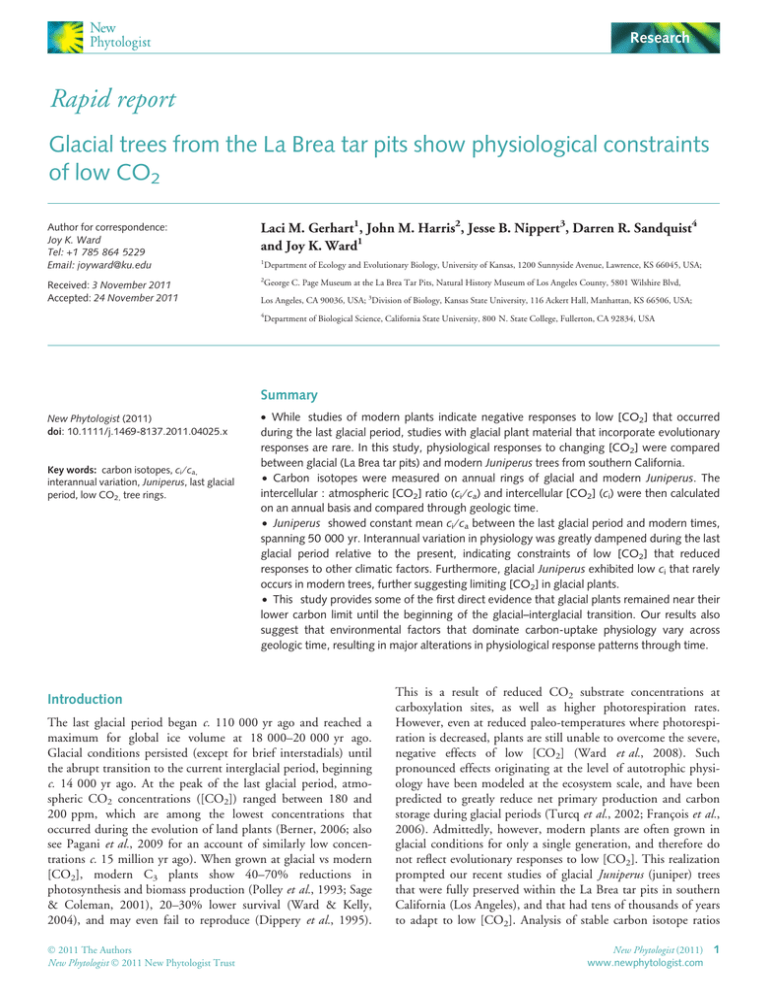
Research Rapid report Glacial trees from the La Brea tar pits show physiological constraints of low CO2 Author for correspondence: Joy K. Ward Tel: +1 785 864 5229 Email: joyward@ku.edu Laci M. Gerhart1, John M. Harris2, Jesse B. Nippert3, Darren R. Sandquist4 and Joy K. Ward1 Received: 3 November 2011 Accepted: 24 November 2011 2 1 Department of Ecology and Evolutionary Biology, University of Kansas, 1200 Sunnyside Avenue, Lawrence, KS 66045, USA; George C. Page Museum at the La Brea Tar Pits, Natural History Museum of Los Angeles County, 5801 Wilshire Blvd, Los Angeles, CA 90036, USA; 3Division of Biology, Kansas State University, 116 Ackert Hall, Manhattan, KS 66506, USA; 4 Department of Biological Science, California State University, 800 N. State College, Fullerton, CA 92834, USA Summary New Phytologist (2011) doi: 10.1111/j.1469-8137.2011.04025.x Key words: carbon isotopes, ci ⁄ ca, interannual variation, Juniperus, last glacial period, low CO2, tree rings. • While studies of modern plants indicate negative responses to low [CO2] that occurred during the last glacial period, studies with glacial plant material that incorporate evolutionary responses are rare. In this study, physiological responses to changing [CO2] were compared between glacial (La Brea tar pits) and modern Juniperus trees from southern California. • Carbon isotopes were measured on annual rings of glacial and modern Juniperus. The intercellular : atmospheric [CO2] ratio (ci ⁄ ca) and intercellular [CO2] (ci) were then calculated on an annual basis and compared through geologic time. • Juniperus showed constant mean ci ⁄ ca between the last glacial period and modern times, spanning 50 000 yr. Interannual variation in physiology was greatly dampened during the last glacial period relative to the present, indicating constraints of low [CO2] that reduced responses to other climatic factors. Furthermore, glacial Juniperus exhibited low ci that rarely occurs in modern trees, further suggesting limiting [CO2] in glacial plants. • This study provides some of the first direct evidence that glacial plants remained near their lower carbon limit until the beginning of the glacial–interglacial transition. Our results also suggest that environmental factors that dominate carbon-uptake physiology vary across geologic time, resulting in major alterations in physiological response patterns through time. Introduction The last glacial period began c. 110 000 yr ago and reached a maximum for global ice volume at 18 000–20 000 yr ago. Glacial conditions persisted (except for brief interstadials) until the abrupt transition to the current interglacial period, beginning c. 14 000 yr ago. At the peak of the last glacial period, atmospheric CO2 concentrations ([CO2]) ranged between 180 and 200 ppm, which are among the lowest concentrations that occurred during the evolution of land plants (Berner, 2006; also see Pagani et al., 2009 for an account of similarly low concentrations c. 15 million yr ago). When grown at glacial vs modern [CO2], modern C3 plants show 40–70% reductions in photosynthesis and biomass production (Polley et al., 1993; Sage & Coleman, 2001), 20–30% lower survival (Ward & Kelly, 2004), and may even fail to reproduce (Dippery et al., 1995). ! 2011 The Authors New Phytologist ! 2011 New Phytologist Trust This is a result of reduced CO2 substrate concentrations at carboxylation sites, as well as higher photorespiration rates. However, even at reduced paleo-temperatures where photorespiration is decreased, plants are still unable to overcome the severe, negative effects of low [CO2] (Ward et al., 2008). Such pronounced effects originating at the level of autotrophic physiology have been modeled at the ecosystem scale, and have been predicted to greatly reduce net primary production and carbon storage during glacial periods (Turcq et al., 2002; François et al., 2006). Admittedly, however, modern plants are often grown in glacial conditions for only a single generation, and therefore do not reflect evolutionary responses to low [CO2]. This realization prompted our recent studies of glacial Juniperus (juniper) trees that were fully preserved within the La Brea tar pits in southern California (Los Angeles), and that had tens of thousands of years to adapt to low [CO2]. Analysis of stable carbon isotope ratios New Phytologist (2011) 1 www.newphytologist.com 2 Research New Phytologist Rapid report of complete wood samples (that integrate all tree rings from a given individual) show severely reduced internal [CO2] (ci) during the last glacial period that are unprecedented in modern equivalents, strongly suggesting the existence of major carbon limitations on tree physiology (Ward et al., 2005). Thus, the low [CO2] of glacial periods likely produced a bottleneck on carbon exchange through reduced transfer of CO2 from the atmosphere to the biosphere. However, it is still unknown if low [CO2] presented an overriding limitation on plant physiology relative to other climatic factors (e.g. water, temperature). The last glacial period represents an ideal time period for addressing this issue, since climate was more variable on an interannual basis and [CO2] was exceptionally low relative to modern times (Mayewski et al., 2004). More specifically, ice cores from Greenland indicate extreme stability of Holocene climate compared with that of the last glacial period (Dansgaard et al., 1993). In addition, Dansgaard–Oeschger (D–O) cycles, which are periods of rapid and abrupt changes in temperature, dust content, ice accumulation and greenhouse gas concentrations, were more prominent during the last glacial period relative to the Holocene (Broecker, 1994; Roy et al., 1996). These patterns recorded in Greenland ice are also documented in ocean sediment cores from the Santa Barbara Basin (Behl & Kennett, 1996; Heusser, 1998; Hendy & Kennett, 1999; Hendy et al., 2002), c. 100 km northwest of La Brea, our primary research site. Analyses of these cores show a strong teleconnection between atmospheric trends over Greenland and ocean dynamics off the California coast, identifying synchronous climatic events between the two records over the last 60 000 yr (Behl & Kennett, 1996; Heusser, 1998; Hendy & Kennett, 1999; Hendy et al., 2002). In previous work, we did not have wood specimens that allowed for carbon isotope analysis of individual tree rings. Recent excavations at the La Brea tar pits have now yielded higher-quality Juniperus specimens, allowing for discernment of individual tree rings. Thus, these wood specimens make an excellent model system for testing the constraints of low [CO2] on tree physiology relative to the effects of other climatic factors during the last glacial period. Here we compare long-term responses of tree physiology, as well as interannual variation within individuals, between the last glacial period and modern times. In doing so, we find the first evidence that low [CO2] constrained the physiology of glacial trees, as evidenced by a dampened response to interannual climate variability. Materials and Methods Site selection For this study, glacial trees from the Rancho La Brea tar pits (Los Angeles) were sampled and 14C dated to 14.5–47.6 kyr before present (BP), with the majority of specimens dating to the last glacial period. Juniperus samples from Rancho La Brea cannot be identified to the species level, although analysis by a wood anatomy expert (Ward et al., 2005) and species distributions indicate these samples are either J. californica or J. occidentalis. Cores of modern trees were collected from three low elevation sites in the Angeles National Forest (J. californica, two trees per site, one core per tree) and three high elevation sites in the San Bernardino National Forest (J. occidentalis, three trees per site, one core per tree), which are close in proximity to La Brea. Only modern trees from natural areas with well-drained, nonirrigated soils were sampled. Low-elevation sites provided a same-site control for glacial La Brea (with the full suite of environmental changes through time), whereas high-elevation sites controlled for lower temperatures and higher precipitation of the last glacial period (see Table 1, Heusser, 1998; Daly et al., 2008), allowing for isolation of CO2 effects. Note that conditions at glacial La Brea were wetter than modern times, which differs from most regions that were drier during the last glacial period. While [CO2] does not vary with elevation, CO2 partial pressure decreases in proportion to total atmospheric pressure. Under modern conditions, partial pressures of CO2 at high-elevation sites are 10–30% lower than Table 1 Climate data for glacial and modern Juniperus sampling sites Site category Site name and coordinates Glacial La Brea Tar Pits + 34"3¢48¢¢, ) 118"21¢22¢¢ Big Bear Lake + 34"16¢12¢¢, ) 116"55¢29¢¢ Hwy 38 Bend + 34"11¢35¢¢, ) 116"47¢6¢¢ Wildhorse Springs + 34"9¢52¢¢, ) 116"43¢14¢¢ Mt. Emma Rd + 34"28¢55¢¢, ) 118"4¢2¢¢ Littlerock Reservoir + 34"29¢42¢¢, ) 118"1¢36¢¢ Lyttle Creek + 34"11¢22¢¢, ) 117"26¢11¢¢ Modern high elevation (SBNF) Modern low elevation (ANF) Elevation (m) 80 Mean annual precipitation (mm) c. 600 Mean annual temperature ("C) c. 7.5–9.5 2830 696 7.3 2300 452 11.1 2300 572 8.7 1340 242 14.7 1045 230 14.9 630 390 18.2 Climate data for glacial La Brea (Heusser, 1998), and modern sampling sites (Daly et al., 2008). Modern samples were collected from San Bernardino National Forest (SBNF) and Angeles National Forest (ANF). New Phytologist (2011) www.newphytologist.com ! 2011 The Authors New Phytologist ! 2011 New Phytologist Trust New Phytologist at low-elevation sites, producing an even more conservative comparison between glacial and modern conditions. Stable isotope measurement We measured stable carbon isotope ratios on alpha-cellulose from individual tree rings of glacial and modern Juniperus. Whole tree rings were analyzed in order to provide an integrated measure of the full annual response. Ring wood was separated under a dissecting microscope and alpha-cellulose was extracted from each ring using the method described by Ward et al. (2005). Previous work using this method has documented high purity levels of alpha-cellulose with no indication of asphalt contamination from the tar pits. Purity was based on theoretical O : H ratios (weight percent oxygen : weight percent hydrogen) of 7.79–8.08 for alpha-cellulose, with actual values falling well within this range (8.01 ± 0.02 and 7.97 ± 0.04 for modern and glacial samples, respectively, Ward et al., 2005). Because our specific compound reflected high purity levels, we do not believe that diagenetic processes would have influenced our results. Of the five glacial wood specimens that were available with an adequate number of tree rings, three are trunk specimens while two may be either portions of the trunk or large branch sections. For modern trees, the 10 rings nearest the center were excluded, as is common on dendrochronological work, as the juvenile stage often exhibits altered physiological patterns. Apart from this exception, all available rings in all samples were analyzed. Isotope measurements were performed at the Keck Paleoenvironmental and Environmental Stable Isotope Laboratory (KPESIL) at the University of Kansas. d13C values were calculated using the following formula: d ¼ Rsample =Rstandard " 1 where R is the ratio of 13C : 12C, using belemnite carbonate from the Pee Dee Formation, Hemingway, SC (PDB) as the standard. Data were converted to ‘per mil’ (&) notation by multiplying d values by 1000. d13Ccell was converted to d13Cleaf using a constant offset of –3.2& (Leavitt & Long, 1982; Ward et al., 2005). Carbon isotope discrimination was calculated as: D¼ d13 Cair " d13 Cleaf 1 þ d13 Cleaf Conversion to carbon discrimination is necessary as it incorporates changes in d13Cair through time. d13Cair was )0.0066 ()6.6&) during glacial times, but has decreased in modern times to )0.008 ()8.0&; Leuenberger et al., 1992). From D, ci ⁄ ca was calculated as ci D " a ¼ ca b " a where a is the fractionation against 13C as a result of slower diffusion across the stomata (4.4&) and b is the fractionation against 13 C as a result of Rubisco (27&). ! 2011 The Authors New Phytologist ! 2011 New Phytologist Trust Rapid report Research 3 For each ring, ci was also calculated from the ci ⁄ ca ratio using ca values. For modern samples, ca values were obtained from direct atmospheric measurements (Keeling et al., 2009) and the Taylor Law Dome ice core (Etheridge et al., 1996). For glacial trees, ca values were obtained from the Vostok and EPICA Dome C ice cores (Lüthi et al., 2008). To obtain the appropriate ca values, 14 C ages of glacial trees were first converted to calendar ages in order to coincide with ice core data (Beck et al., 2001). Since atmospheric [CO2] showed only minimal changes throughout the latter portion of the last glacial period that is encompassed in our study, we are confident that [CO2] values corresponding to converted ages are accurate to the actual conditions experienced by glacial trees. Statistical analyses Mean ci ⁄ ca values for high- and low-elevation modern Juniperus were not significantly different despite environmental differences between these locations (0.53 ± 0.05 and 0.53 ± 0.06, P = 0.1; ANOVA), and therefore, the two modern sets were grouped together for comparison to glacial values. Since the variance in ci ⁄ ca was significantly different between modern and glacial Juniperus (P < 0.0001), a Welch’s ANOVA was used to compare modern and glacial ci ⁄ ca values that account for lack of equivalence of variance. The coefficient of variation (CV) was calculated for ci ⁄ ca in both modern and glacial samples. CV provides a measure of dispersion of data around the mean, allowing us to compare variation between groups. CV was calculated as: CV ¼ s !x wheres is the standard deviation, and x! is the mean. Data are shown in percentage notation by multiplying CV by 100. In order to account for differences in chronology length between glacial (shorter) and modern (longer) samples, the following correction (Sokal & Rohlf, 1995) was applied to CV: CV corr ¼ ! " 1 1þ CV 4n Correlation of modern ci ⁄ ca with climate To determine correlations of modern ci ⁄ ca values with climate, monthly temperature and precipitation data were obtained for each site from PRISM (Daly et al., 2008). The PRISM model is ideal for this comparison as it accurately reflects climatic conditions in mountainous coastal regions with large elevational gradients and complex topography (Daly et al., 2008). Measures of temperature and precipitation alone provided only weak correlations with ci ⁄ ca, so vapor pressure deficit (VPD) was used for this correlation. VPD is a more integrative climatic parameter that combines water and temperature relationships and is closely linked to evapotranspiration, making this measure more directly related to plant physiology than temperature or precipitation New Phytologist (2011) www.newphytologist.com 4 Research New Phytologist Rapid report alone. VPD was calculated from monthly average maximum (Tmax), minimum (Tmin) and dewpoint (Tdew) temperatures using: 0.70 (a) 0.65 ca = 190–210 ppm 265 ppm 280–390 ppm 0.60 VPD ¼ es ðTmax Þ þ es ðTmin Þ " es ðTdew Þ 2 0.55 0.50 where es(T) is the saturation vapor pressure at temperature T, calculated as: ! " 17:67T es ðT Þ ¼ 0:6112 exp T þ 243:5 In order to correlate ring isotopic composition with VPD, rings of modern trees were associated with specific calendar years. Ring width patterns from trees within the same site were correlated and aligned using marker years of high precipitation and growth. 0.45 0.40 0.35 250 (b) 225 200 175 150 125 Results and Discussion The ci ⁄ ca ratio is driven by two fundamental processes: stomatal conductance, which controls the rate of CO2 diffusion from the atmosphere into the intercellular spaces of leaves; and chloroplast demand for CO2, which is determined by internal CO2 diffusion rates to carboxylation sites and photosynthetic biochemistry. Long-term trends in ci ⁄ ca over evolutionary timescales reflect the degree of coordination between processes affecting CO2 supply and demand within the leaf. In addition, shorter-term trends in ci ⁄ ca (e.g. annual rings) reflect integrated shifts in tree physiology in response to changing environmental conditions within the lifespan of a single individual. We found that mean ci ⁄ ca of Juniperus was similar between glacial and modern trees (Fig. 1a; glacial average, 0.52 ± 0.02; modern average, 0.53 ± 0.05; P > 0.2). One possible explanation for this, although one not supported by the literature, is that both stomatal conductance and chloroplast demand for CO2 remained constant across this expansive period of [CO2] and climatic change. On the other hand, if only one of these factors predominantly changed through time, there would have been shifts in ci ⁄ ca, which were not observed here. It is therefore most likely that both stomatal conductance and chloroplast demand for CO2 were higher during the last glacial period, which would have enhanced CO2 uptake under limiting carbon conditions. When supply and internal demand for CO2 covary in the same direction, as has been observed even in highly disparate taxa (Franks & Beerling, 2009a), there are opposing effects on ci ⁄ ca, likely producing the stabilization effect observed here. When moving into the interglacial period, both stomatal conductance and chloroplast CO2 demand likely decreased, with the effect of saving water and nitrogen as CO2 became less limiting. In support of this idea, Ehleringer & Cerling (1995) hypothesized that ci ⁄ ca represents a metabolic set point that is maintained within species across time. In addition, increases in stomatal conductance are almost always observed in modern C3 plants grown at low [CO2] (Gerhart & Ward, 2010), and studies with glacial leaves show New Phytologist (2011) www.newphytologist.com 100 47.6 45.1 44.1 37.7 22.0 14.5 Modern (kyr before present) High elev. Low elev. Fig. 1 Results of stable carbon isotope measurements for glacial and modern Juniperus tree rings. (a) Intercellular : atmospheric [CO2] ratio (ci ⁄ ca values); (b) corresponding intercellular [CO2] (ci values). Each point represents an individual tree ring, and vertical groups represent results from all available tree rings for an individual tree, with values stacked from highest to lowest. Glacial samples are shown in different colors, while modern samples are grouped by elevation (to distinguish two different control groups), with means labeled as black boxes. Atmospheric [CO2] values (ca) are provided for each group. The range provided for modern samples reflects a temporal gradient experienced by each tree over its lifetime as a result of rapid changes in atmospheric [CO2] in the modern period. evidence for increased stomatal density and decreased stomatal size, which would have increased maximum stomatal conductance in the past (Beerling et al., 1993; Franks & Beerling, 2009b; but also see Malone et al., 1993 for responses of modern plants grown at low [CO2]). The wetter conditions of the last glacial period may have also provided increased nitrogen availability to support higher leaf nitrogen contents, which may have enhanced photosynthetic capacity. Despite any physiological adjustments, ci values remained extremely low in glacial trees relative to modern trees as a result of consistently low ca throughout the last glacial period (Fig 1b; glacial average, 106 ± 6; modern average, 168 ± 20; P < 0.0001). Past studies have reported similarly low ci values in glacial needles of Pinus flexilis preserved in packrat middens (Van de Water et al., 1993; Beerling, 1994). When considering all available rings, the vast majority of glacial ci values fell outside the range of modern values. In fact, no modern trees experienced ci values below 114 ppm, and no glacial trees experienced values > 120 ppm, leaving only a narrow overlapping range. It is also interesting to note that ci values of glacial trees never fell below 90 ppm over an integrated annual period. This suggests that this ! 2011 The Authors New Phytologist ! 2011 New Phytologist Trust New Phytologist Rapid report may be a limiting concentration below which juniper trees may not maintain a positive carbon budget for basic physiological functions for survival (Campbell et al., 2005). Interannual variation in ci ⁄ ca, represented by CVcorr, was significantly lower in glacial vs modern trees (P < 0.0002; Fig. 2). More specifically, low- and high-elevation modern trees showed CVcorr values of 8 ± 2% and 8 ± 3%, respectively. The only available Holocene specimen (14.5 kyr BP) showed an intermediate CVcorr value of 5%, while glacial specimens showed the lowest values, averaging 3 ± 1%. Furthermore, although modern trees show occasional, short-term periods of low interannual variation, these periods are rare. Glacial trees show consistently low variation in ci ⁄ ca in all cases. In fact, the two oldest glacial Juniperus samples (45.1 and 47.6 kyr old) correspond to the timing of D–O events recorded in Greenland glaciers 0.70 47.6 kyr BP 209 ppm Research 5 (Blunier & Brook, 2001). The maintenance of low interannual variation in ci ⁄ ca, even during time periods of rapid and drastic environmental change that are characteristic of D–O cycles, suggests that the maintenance of low variation in glacial Juniperus physiology was consistent throughout the last glacial period. In a plethora of past studies, modern Juniperus in southern California and the southwestern US exhibits high interannual variation in ci ⁄ ca, mainly as a result of changes in soil water availability from year to year (Leavitt & Long, 1989; Feng & Epstein, 1995; Moore et al., 1999; Leffler et al., 2002). In our study, the ci ⁄ ca of modern trees showed the strongest correlations with monthly or seasonal VPD (R2 = 0.06–0.25; P < 0.05–0.0001), whereby the months showing the strongest correlations were offset between elevations. Although these correlations were relatively low, similar correlations have been reported for modern Juniperus 44.1 kyr BP 209 ppm 45.1 kyr BP 209 ppm ci /ca 0.60 0.50 0.40 CVcorr = 4% 0 5 0.70 CVcorr = 3% 10 15 20 25 30 Ring number 0 3 6 CVcorr = 2% 9 Ring number 37.7 kyr BP 198 ppm 12 0 5 10 15 Ring number 22 kyr BP 194 ppm 20 14.5 14 5 kyr BP 265 ppm ci /ca 0.60 0.50 0.40 CVcorr = 5% 0 10 20 CVcorr = 3% 40 0 30 Ring number 0.70 ci /ca 0.60 CVcorr = 5% 10 15 20 25 30 0 Ring number 30 60 90 120 Ring number Modern low elevation 280–390 ppm 0.50 0.40 Mean CV corr = 8 1800 0.70 0.60 ci /ca 5 1820 2% 1840 1860 1880 1900 Year 1920 1940 1960 1980 2000 1880 1900 Year 1920 1940 1960 1980 2000 Modern high elevation 280–390 ppm 0.50 0.40 Mean CV corr = 8 1800 1820 3% 1840 1860 Fig. 2 Annual responses of intercellular : atmospheric [CO2] ratio (ci ⁄ ca) for modern and glacial Juniperus. These are the same data as in Fig. 1, although in this case, data are placed in chronological order throughout the development of each tree. Full chronologies are not available for glacial trees, and therefore data are arranged from youngest (ring number 1) to oldest. Glacial samples are shown in the same colors as in Fig. 1, although modern samples are given different colors in order to distinguish their responses. 14C age (thousands of years before present, kyr BP) atmospheric [CO2], and CVcorr (interannual variation in ci ⁄ ca, see the ‘Materials and Methods’ section for details) are provided for each sample and ⁄ or control group for the sake of comparison. The atmospheric [CO2] range provided for modern samples reflects a temporal gradient experienced by each tree over its lifetime as a result of rapid changes in atmospheric [CO2] in the modern period. [Correction added after online publication 20 December 2012: a corrected version of Fig. 2 is now published here, where the following corrections have been applied: Row 1, panel three: the text which previously read as ‘CVcorr = 3%’ now reads as ‘CVcorr = 2%’; row 2, panel three: the text which previously read as ‘CVcorr = 59%’ now reads as ‘CVcorr = 5%’]. ! 2011 The Authors New Phytologist ! 2011 New Phytologist Trust New Phytologist (2011) www.newphytologist.com 6 Research Rapid report in other studies (Leavitt & Long, 1989), and in all cases, soil water parameters and ⁄ or VPD correlate most closely with tree physiology (Leavitt & Long, 1989; Feng & Epstein, 1995; Moore et al., 1999; Leffler et al., 2002). Since glacial climate was much more variable than in modern times, one would expect glacial ci ⁄ ca to also show higher variation if trees were responding to similar climatic factors. To the contrary, we found reduced amounts of interannual variation in ci ⁄ ca during the last glacial period (Fig. 2), indicating that a stable environmental factor dominated tree physiology. During the last glacial period, [CO2] was extremely stable from year to year (EPICA, 2004), while water availability and temperature were predicted to have been highly variable (Behl & Kennett, 1996; Heusser, 1998; Hendy & Kennett, 1999; Hendy et al., 2002). In our study, extremely low ci values coupled with reduced variation in ci ⁄ ca, even under a highly fluctuating glacial climate, point strongly to low [CO2] constraints on tree physiology. While short-term studies with modern plants grown at glacial [CO2] show major carbon limitations on physiology, our findings highlight the strength and consistency of low CO2 constraints over evolutionary timescales. In conclusion, this study has demonstrated that mean ci ⁄ ca has been maintained in Juniperus between the last glacial period and modern times, despite changes in temperature, precipitation and [CO2]; that glacial ci values were extremely low on an annual basis and occur only rarely in modern trees; that a limiting level for Juniperus physiology may exist at or near 90 ppm; and that interannual variation in ci ⁄ ca was greatly reduced in glacial Juniperus, likely as a result of the constraints of low [CO2] that overrode responses to other climatic factors. This is the first direct evidence from trees that actually lived and evolved under low [CO2] that carbon limitation persisted on an annual basis during the last glacial period. Moreover, our results suggest that the environmental factors that dominate carbon-uptake physiology can vary across geologic timescales, resulting in major alterations in physiological response patterns through time. Acknowledgements This work was supported by the National Science Foundation (NSF) CAREER (0746822) and PECASE awards, and the Wohlgemuth Faculty Scholar Award (endowed by D. Lynch) to J.K.W. The NSF C-CHANGE IGERT fellowship (0801522) and the Madison and Lila Self Graduate Fellowship supported L.M.G. at KU. The Department of Ecology and Evolutionary Biology (KU) also provided assistance for this work. The authors thank G. Cane (KPESIL, KU), E. Duffy (EEB, KU) and K. Colvin (EEB, KU) for assistance with isotope analysis, and J. Nickerman (Angeles National Forest) and M. Lardner (San Bernardino National Forest) for field permit assistance. The authors also thank three anonymous reviewers for their helpful comments. References Beck JW, Richards DA, Edwards RL, Silverman BW, Smart PL, Donahue DJ, Hererr-Osterheld S, Burr GS, Calsoyas L, Jull AJT et al. 2001. Extremely New Phytologist (2011) www.newphytologist.com New Phytologist large variations of atmospheric 14C concentration during the last glacial period. Science 292: 2453–2458. Beerling DJ. 1994. Predicting leaf gas exchange and d13C responses to the past 30,000 years of global environmental change. New Phytologist 128: 425–433. Beerling DJ, Chaloner WG, Huntley B, Pearson JA, Tooley MJ. 1993. Stomatal density responds to the glacial cycle of environmental change. Proceedings of the Royal Society of London Series B-Biological Sciences 253: 53–60. Behl RJ, Kennett JP. 1996. Brief interstadial events in the Santa Barbara basin, NE Pacific, during the past 60 kyr. Nature 379: 243–246. Berner RA. 2006. GEOCARBSULF: a combined model for Phanerozoic atmospheric O2 and CO2. Geochimica et Cosmochiica Acta 70: 5653–5664. Blunier T, Brook EJ. 2001. Timing of millennial-scale climate change in Antarctica and Greenland during the last glacial period. Science 291: 109–112. Broecker WS. 1994. Massive iceberg discharges as triggers for global climate change. Nature 372: 421–424. Campbell CD, Sage RF, Kocacinar F, Way DA. 2005. Estimation of the wholeplant CO2-compensation point of tobacco (Nicotiana tabacum L.). Global Change Biology 11: 1956–1967. Daly C, Halbleib M, Smith JI, Gibson WP, Doggett MK, Taylor GH, Curtis J, Pasteris PP. 2008. Physiographically sensitive mapping of climatological temperature and precipitation across the conterminous United States. International Journal of Climatology 28: 2031–2064. Dansgaard W, Johnsen SJ, Clausen HB, Dahl-Jensen D, Gundestrup NS, Hammer CU, Hvidberg CS, Steffensen JP, Sveinbjornsdottir AE, Jouzel J et al. 1993. Evidence for general instability of past climate from a 25-kyr ice-core record. Nature 364: 218–220. Dippery JK, Tissue DT, Thomas RB, Strain BR. 1995. Effects of low and elevated CO2 on C3 and C4 annuals. I. Growth and biomass allocation. Oecologia 101: 13–20. Ehleringer JR, Cerling TE. 1995. Atmospheric CO2 and the ratio of intercellular to ambient CO2 concentrations in plants. Tree Physiology 15: 105–111. EPICA. 2004. Eight glacial cycles from an Antarctic ice core. Nature 429: 623–628. Etheridge DM, Steele LP, Langenfelds RL, Francey RJ, Barnola J-M, Morgan VI. 1996. Natural and anthropogenic changes in atmospheric CO2 over the last 1,000 years from air in Antarctic ice and firn. Journal of Geophysical Research 101: 4115–4128. Feng X, Epstein S. 1995. Carbon isotopes of trees from arid environments and implications for reconstructing atmospheric CO2 concentration. Geochimica et Cosmochimica Acta 59: 2599–2608. François LM, Ghislain M, Otto D, Micheels A. 2006. Late Miocene vegetation reconstruction with the CARAIB model. Palaeogeography Palaeoclimatology Palaeoecology 238: 302–320. Franks PJ, Beerling DJ. 2009a. CO2-forced evolution of plant gas exchange capacity and water-use efficiency over the Phanerozoic. Geobiology 7: 227–236. Franks PJ, Beerling DJ. 2009b. Maximum leaf conductance driven by CO2 effects on stomatal size and density over geologic time. Proceedings of the National Academy of Sciences, USA 106: 10343–10347. Gerhart LM, Ward JK. 2010. Plant responses to low [CO2] of the past. New Phytologist 188: 674–695. Hendy IL, Kennett JP. 1999. Latest Quaternary North Pacific surface-water responses imply atmosphere-driven climate instability. Geology 27: 291–294. Hendy IL, Kennett JP, Roark EB, Ingram BL. 2002. Apparent synchroneity of submillennial scale climate events between Greenland and Santa Barbara Basin, California from 30–10 ka. Quaternary Science Reviews 21: 1167–1184. Heusser L. 1998. Direct correlation of millennial-scale changes in western North American vegetation and climate with changes in the California Current System over the past & 60 kyr. Paleoceanography 13: 252–262. Keeling RF, Piper SC, Bollenbacher AF, Walker JS. 2009. Atmospheric CO2 records from sites in the SIO air sampling network. In: Trends: a compendium of data on global change. Oak Ridge, TN, USA: Carbon Dioxide Information Analysis Center, Oak Ridge National Laboratory, US Department of Energy doi: 10.334/CDIAC/atg.035 Leavitt SW, Long A. 1982. Evidence for 13C ⁄ 12C fractionation between tree leaves and wood. Nature 298: 742–744. ! 2011 The Authors New Phytologist ! 2011 New Phytologist Trust New Phytologist Leavitt SW, Long A. 1989. Drought indicated in carbon-13 ⁄ carbon-12 ratios of southwestern tree rings. Water Resource Bulletin 25: 341–347. Leffler AJ, Ryel RJ, Hipps L, Ivans S, Caldwell MM. 2002. Carbon acquisition and water use in a northern Utah Juniperus osteosperma (Utah juniper) population. Tree Physiology 22: 1221–1230. Leuenberger M, Siegenthaler U, Langway C. 1992. Carbon isotope composition of atmospheric CO2 during the last ice age from an Antarctic ice core. Nature 357: 488–490. Lüthi D, Le Floch M, Bereiter B, Blunier T, Barnola J-M, Siegenthaler U, Raynaud D, Jouzel J, Fischer H, Kawamura K et al. 2008. High-resolution carbon dioxide concentration record 650,000–800,000 years before present. Nature 453: 379–382. Malone SR, Mayeux HS, Johnson HB, Polley HW. 1993. Stomatal density and aperture length in four plan species grown across a subambient CO2 gradient. American Journal of Botany 80: 1413–1418. Mayewski PA, Eohling EE, Stager JC, Karlén W, Maasch KA, Meeker LD, Meyerson EA, Gasse F, van Kreveld S, Holmgren K et al. 2004. Holocene climate variability. Quaternary Research 62: 243–255. Moore DJ, Nowak RS, Tausch RJ. 1999. Gas exchange and carbon isotope discrimination of Juniperus osteosperma and Juniperus occidentalis across environmental gradients in the Great Basin of western North America. Tree Physiology 19: 421–433. Pagani M, Caldeira K, Berner R, Beerling DJ. 2009. The role of terrestrial plants in limiting atmospheric CO2 decline over the past 24 million years. Nature 460: 85–88. ! 2011 The Authors New Phytologist ! 2011 New Phytologist Trust Rapid report Research 7 Polley HW, Johnson HB, Marino BD, Mayeux HS. 1993. Increase in C3 plant water-use efficiency and biomass over glacial to present CO2 concentrations. Nature 361: 61–64. Roy K, Valentine JW, Jablonski D, Kidwell SM. 1996. Scales of climatic variability and time averaging in Pleistocene biotas: implications for ecology and evolution. Trends in Ecology and Evolution 11: 458–463. Sage RF, Coleman JR. 2001. Effects of low atmospheric CO2 in plants: more than a thing of the past. Trends in Plant Science 6: 18–24. Sokal RR, Rohlf FJ. 1995. Biometry, 3rd edn. New York, NY, USA: Freeman & Co. Turcq B, Cordeiro RC, Sifeddine A, Simões Filho FFL, Albuquerque ALS, Abrão JJ. 2002. Carbon storage in Amazonia during the Last Glacial Maximum: secondary data and uncertainties. Chemosphere 49: 821–835. Van de Water PK, Leavitt SW, Betancourt JL. 1993. Trends in stomatal density and 13C ⁄ 12C ratios of Pinus flexilis needles during last glacial-interglacial cycle. Science 264: 239–243. Ward JK, Harris JM, Cerling TE, Wiedenhoeft A, Lott MJ, Dearing M-D, Coltrain JB, Ehleringer JR. 2005. Carbon starvation in glacial trees recovered from the La Brea tar pits, southern California. Proceedings of the National Academy of Sciences, USA 102: 690–694. Ward JK, Kelly JK. 2004. Scaling up evolutionary responses to elevated CO2: lessons from Arabidopsis. Ecology Letters 7: 427–440. Ward JK, Myers DA, Thomas RB. 2008. Physiological and growth responses of C3 and C4 plants to reduced temperature when grown at low CO2 of the last ice age. Journal of Integrative Plant Biology 50: 1388–1395. New Phytologist (2011) www.newphytologist.com
