Journal of Biogeography
advertisement
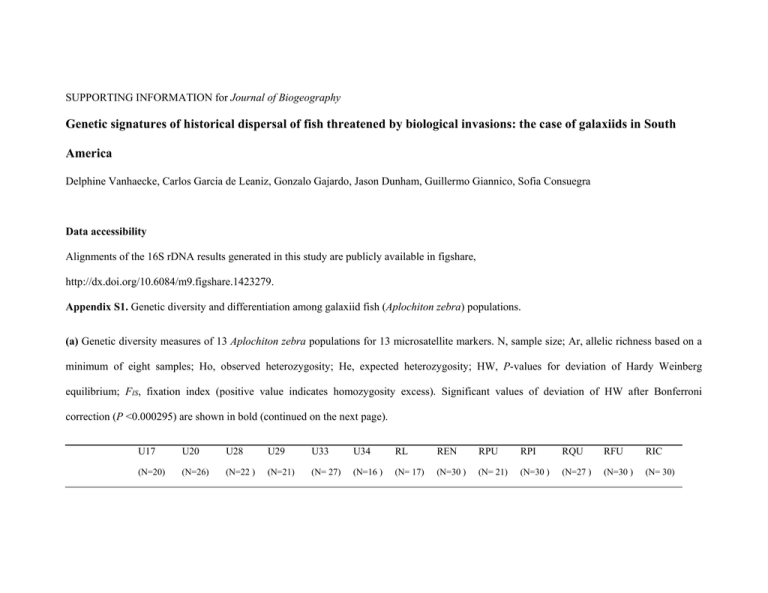
SUPPORTING INFORMATION for Journal of Biogeography Genetic signatures of historical dispersal of fish threatened by biological invasions: the case of galaxiids in South America Delphine Vanhaecke, Carlos Garcia de Leaniz, Gonzalo Gajardo, Jason Dunham, Guillermo Giannico, Sofia Consuegra Data accessibility Alignments of the 16S rDNA results generated in this study are publicly available in figshare, http://dx.doi.org/10.6084/m9.figshare.1423279. Appendix S1. Genetic diversity and differentiation among galaxiid fish (Aplochiton zebra) populations. (a) Genetic diversity measures of 13 Aplochiton zebra populations for 13 microsatellite markers. N, sample size; Ar, allelic richness based on a minimum of eight samples; Ho, observed heterozygosity; He, expected heterozygosity; HW, P-values for deviation of Hardy Weinberg equilibrium; FIS, fixation index (positive value indicates homozygosity excess). Significant values of deviation of HW after Bonferroni correction (P <0.000295) are shown in bold (continued on the next page). U17 U20 U28 U29 U33 U34 RL REN RPU RPI RQU RFU RIC (N=20) (N=26) (N=22 ) (N=21) (N= 27) (N=16 ) (N= 17) (N=30 ) (N= 21) (N=30 ) (N=27 ) (N=30 ) (N= 30) Aze 1 Aze 2 Aze 3 Aze 4 Ar 2.65 2.98 3.05 2.55 2.32 3.26 2.00 3.12 1.87 3.89 3.75 3.14 2.45 Ho 0.30 0.58 0.32 0.29 0.56 0.56 0.53 0.37 0.10 0.53 0.56 0.33 0.47 He 0.52 0.54 0.32 0.26 0.50 0.56 0.44 0.39 0.17 0.50 0.53 0.46 0.37 HW 0.16 1.00 0.54 1.00 1.00 1.00 0.61 0.63 0.14 1.00 1.00 0.07 0.29 FIS 0.42 -0.06 0.00 -0.12 -0.11 -0.01 -0.21 0.06 0.45 -0.07 -0.06 0.27 -0.26 Ar 5.29 4.57 4.81 4.39 4.10 3.71 3.47 2.53 2.38 5.06 5.01 4.78 5.25 Ho 0.70 0.69 0.70 0.79 0.80 0.63 0.59 0.47 0.43 0.67 0.63 0.83 0.80 He 0.80 0.69 0.66 0.68 0.69 0.65 0.65 0.50 0.44 0.76 0.76 0.74 0.75 HW 0.59 0.71 1.00 0.18 0.68 1.00 0.33 0.70 1.00 0.38 0.68 0.23 0.69 FIS 0.12 0.01 -0.06 -0.16 -0.17 0.04 0.10 0.06 0.03 0.12 0.17 -0.13 -0.06 Ar 2.40 2.31 2.38 1.99 1.98 1.95 1.47 2.83 2.86 2.00 2.59 2.47 2.72 Ho 0.50 0.42 0.19 0.10 0.15 0.13 0.06 0.50 0.38 0.47 0.48 0.47 0.37 He 0.52 0.48 0.42 0.31 0.30 0.22 0.06 0.42 0.47 0.44 0.47 0.49 0.40 HW 1.00 0.68 0.02 0.01 0.02 0.19 1.00 0.64 0.33 1.00 1.00 1.00 1.00 FIS 0.03 0.11 0.55 0.69 0.51 0.43 -0.03 -0.18 0.19 -0.05 -0.03 0.04 0.07 Ar 3.50 2.87 4.02 4.84 3.36 4.72 5.09 3.01 3.32 3.36 1.97 4.23 3.42 Ho 0.20 0.00 0.13 0.56 0.29 0.08 0.38 0.32 0.26 0.24 0.08 0.31 0.30 He 0.62 0.31 0.61 0.71 0.62 0.75 0.73 0.43 0.53 0.35 0.28 0.45 0.42 Aze 5 Aze 6 Aze 8 Aze 9 HW 0.00 0.01 0.00 0.10 0.08 0.00 0.03 0.06 0.02 0.21 0.00 0.04 0.31 FIS 0.68 1.00 0.80 0.21 0.54 0.90 0.48 0.25 0.51 0.31 0.70 0.32 0.30 Ar 12.84 12.85 11.39 12.59 13.01 12.04 9.66 10.31 11.03 11.31 12.33 12.46 12.50 Ho 0.80 0.92 0.62 0.74 0.92 0.63 0.82 0.83 0.95 0.90 0.93 0.93 0.97 He 0.95 0.95 0.92 0.94 0.95 0.93 0.89 0.91 0.92 0.93 0.94 0.95 0.95 HW 0.00 0.19 0.02 0.16 1.00 0.02 0.41 0.50 1.00 0.33 1.00 0.24 1.00 FIS 0.15 0.03 0.32 0.22 0.03 0.33 0.08 0.09 -0.03 0.04 0.02 0.01 -0.02 Ar 7.14 6.44 7.67 7.06 5.50 6.24 6.98 7.73 8.09 5.97 5.61 5.79 5.91 Ho 0.89 0.69 0.94 0.79 0.64 0.75 0.82 0.70 0.95 0.77 0.78 0.73 0.63 He 0.83 0.77 0.86 0.83 0.75 0.81 0.83 0.85 0.87 0.79 0.78 0.73 0.73 HW 0.52 0.22 0.52 0.26 0.23 0.20 0.57 0.15 1.00 1.00 1.00 0.72 0.07 FIS -0.07 0.10 -0.10 0.06 0.15 0.08 0.01 0.18 -0.10 0.03 0.01 -0.01 0.13 Ar 7.31 7.98 9.57 11.46 7.52 9.67 7.81 8.60 10.08 10.38 8.29 8.97 10.27 Ho 0.78 0.69 0.89 0.68 0.60 0.73 0.82 0.97 0.95 0.90 0.78 0.73 0.67 He 0.81 0.84 0.90 0.93 0.80 0.87 0.86 0.88 0.91 0.92 0.84 0.87 0.92 HW 0.61 0.18 0.37 0.26 0.08 0.23 1.00 0.29 0.34 0.50 1.00 0.18 1.00 FIS 0.04 0.18 0.00 0.26 0.25 0.16 0.04 -0.10 -0.05 0.02 0.07 0.15 0.27 Ar 9.10 11.55 10.42 11.12 9.54 11.32 8.92 9.50 9.83 12.37 11.72 12.49 12.20 Aze 10 Aze 11 Aze 12 Ho 0.61 0.85 0.94 0.72 0.69 0.71 0.88 0.60 0.86 0.97 0.89 0.97 0.93 He 0.86 0.93 0.91 0.92 0.90 0.91 0.85 0.89 0.91 0.95 0.94 0.95 0.94 HW 0.01 1.00 0.39 1.00 0.00 0.35 1.00 0.00 0.03 1.00 0.27 1.00 1.00 FIS 0.29 0.09 -0.04 0.22 0.23 0.21 -0.04 0.33 0.05 -0.02 0.05 -0.02 0.01 Ar 7.93 7.67 7.08 7.21 8.41 7.32 6.92 5.90 6.70 6.96 6.94 6.97 6.77 Ho 0.71 0.81 0.57 0.62 0.80 0.75 0.88 0.90 1.00 0.73 0.89 0.77 0.83 He 0.85 0.86 0.80 0.83 0.88 0.84 0.83 0.81 0.83 0.83 0.83 0.84 0.83 HW 0.52 0.55 0.33 0.00 1.00 0.54 1.00 0.06 0.13 0.15 1.00 1.00 0.29 FIS 0.17 0.06 0.28 0.26 0.09 0.11 -0.06 -0.11 -0.20 0.11 -0.08 0.09 -0.00 Ar 4.96 4.86 6.81 4.95 3.54 5.62 3.13 4.6 5.32 6.07 5.85 5.11 5.33 Ho 0.50 0.46 0.82 0.38 0.38 0.38 0.41 0.47 0.38 0.73 0.59 0.77 0.50 He 0.63 0.62 0.76 0.59 0.47 0.64 0.35 0.61 0.68 0.76 0.68 0.70 0.72 HW 0.20 0.42 0.66 0.08 0.38 0.06 1.00 0.06 0.08 0.26 0.44 0.71 0.02 FIS 0.20 0.26 -0.07 0.35 0.17 0.42 -0.17 0.23 0.44 0.03 0.12 -0.09 0.30 Ar 12.12 10.38 11.16 11.86 10.85 10.56 10.21 9.52 9.24 7.76 9.43 8.48 9.41 Ho 0.82 0.96 0.89 0.79 0.88 0.69 0.88 1.00 0.90 0.87 0.89 0.93 0.83 He 0.93 0.92 0.91 0.92 0.92 0.91 0.89 0.90 0.90 0.85 0.90 0.88 0.90 HW 0.29 1.00 0.51 0.22 0.38 0.31 0.18 0.55 1.00 1.00 0.55 0.31 1.00 Aze 13 Aze 14 MEAN FIS 0.11 -0.05 0.03 0.15 0.05 Ar 4.31 4.68 6.33 5.64 4.38 Ho 0.55 0.62 0.57 0.52 He 0.57 0.60 0.67 HW 1.00 0.68 FIS 0.03 Ar 0.24 0.01 -0.11 -0.09 -0.02 0.01 -0.06 0.07 4.73 4.07 5.69 5.57 6.12 5.48 5.12 5.58 0.62 0.56 0.53 0.73 0.67 0.73 0.63 0.77 0.63 0.54 0.54 0.65 0.51 0.75 0.79 0.72 0.70 0.69 0.65 0.66 0.62 0.18 0.64 1.00 1.00 1.00 1.00 0.05 0.71 0.48 -0.02 0.15 0.03 -0.14 0.14 -0.04 0.02 0.15 -0.02 0.10 -0.11 0.03 2.79 2.31 2.36 2.62 2.43 2.45 2.20 2.20 1.99 1.95 2.59 1.93 2.00 Ho 0.25 0.35 0.27 0.24 0.31 0.19 0.18 0.03 0.00 0.23 0.30 0.27 0.30 He 0.43 0.49 0.52 0.47 0.27 0.27 0.16 0.26 0.31 0.26 0.40 0.23 0.38 HW 0.01 0.01 0.04 0.01 1.00 0.31 1.00 0.00 0.00 0.50 0.31 1.00 0.33 FIS 0.42 0.29 0.47 0.49 -0.14 0.31 -0.07 0.87 1.00 0.08 0.26 -0.15 0.20 Ar 6.33 6.26 6.70 6.79 5.92 6.43 5.53 5.81 6.02 6.40 6.27 6.30 6.45 Ho 0.59 0.62 0.60 0.55 0.67 0.52 0.60 0.61 0.60 0.67 0.65 0.68 0.63 He 0.71 0.69 0.71 0.69 0.66 0.69 0.62 0.66 0.67 0.70 0.69 0.69 0.69 FIS 0.18 0.11 0.15 0.19 -0.02 0.25 0.03 0.08 0.10 0.03 0.07 0.02 0.08 N 18.7 24.8 19.9 18.8 25.2 15.5 16.9 29.8 20.8 29.6 26.8 29.7 29.7 (b) Pairwise estimates of genetic distances (below diagonal FST, above diagonal Dest) between 13 populations of Aplochiton zebra in Chile, calculated using TFPGA and SMOGD based on 11 microsatellite loci. FST values in bold are significant at P < 0.00064 (after Bonferroni correction). Significant pairwise genetic differentiation (at P < 0.00064) is indicated by an asterisk. U28 U29 U17 U20 U33 U34 RL REN RPU RPI RQU RFU RIC U28 ***** 0.0052 0.1176 0.1525 0.1267 0.0793 0.1766 0.1267 0.1361 0.1576 0.1466 0.1846 0.1276 U29 0.0032 ***** 0.1164 0.1196 0.059 0.0247 0.1265 0.1504 0.1711 0.1347 0.1345 0.1942 0.0944 U17 0.0345* 0.0301* ***** 0.0162 0.001 0.0096 0.0956 0.1764 0.1838 0.1602 0.1475 0.1873 0.1347 U20 0.0487* 0.0423* 0.0091 ***** 0.003 0 0.1181 0.2161 0.2635 0.2118 0.2111 0.2614 0.2135 U33 0.0478* 0.0351* 0.016 0.0065* ***** 0.0078 0.1202 0.1796 0.2355 0.1985 0.1696 0.2282 0.1656 U34 0.0246* 0.0139* 0.0116 0.0045 0.0095 ***** 0.0379 0.1587 0.1903 0.1768 0.1777 0.2083 0.1631 RL 0.0445* 0.0286* 0.0363* 0.0371* 0.034* 0.0137* ***** 0.2072 0.2487 0.2006 0.1529 0.2186 0.1869 REN 0.028* 0.0305* 0.0473* 0.0559* 0.0533* 0.0361* 0.0515* ***** 0 0.2451 0.2324 0.2455 0.2244 RPU 0.0289* 0.0317* 0.0495* 0.0659* 0.0655* 0.0425* 0.0571* 0 ***** 0.2457 0.2612 0.2472 0.2541 RPI 0.0301* 0.0281* 0.035* 0.0517* 0.0524* 0.0385* 0.0515* 0.0531* 0.0504* ***** 0 0 0.003 RQU 0.0311* 0.0294* 0.0382* 0.0467* 0.0505* 0.0376* 0.0427* 0.0557* 0.0567* 0 ***** 0 0.008 RFU 0.0391* 0.04* 0.0426* 0.0585* 0.0617* 0.0455* 0.0574* 0.0628* 0.0594* 0 0 ***** 0.0118 RIC 0.0273* 0.0256* 0.0335* 0.0489* 0.0506* 0.0339* 0.0452* 0.0526* 0.0529* 0.0018 0.0032 0.0054 ***** Appendix S2. Barriers to gene flow among Aplochiton zebra populations in Chile identified by BARRIER v2.2. The Monmonier’s algorithm was used to identify boundaries associated with high genetic heterogeneity, with samples represented according to their geographical coordinates and connected by Delaunay triangulation. Edges were identified by genetic differentiation matrices (FST and Dest). Analyses were conducted for each of the microsatellites separately as well as for the whole set and only those barriers supported by more than 10 microsatellites (from 13) were considered. Coloured lines (pink and red) represent the barriers, green lines represent the Delaunay triangulation between the samples/populations (red dots) and grey lines represent the Voronoï tessellation used to estimate the position of the barriers. (a) (b) Appendix S3. (a) Graphic representation of the three alternative scenarios considered for ABC analysis population colonisation of galaxiid fish (Aplchiton zebra) in Chile and the Falklands. Population codes are as follows: 1= Chiloé, 2= Valdivia, 3=L. Ranco and 4= Falklands (b) logistic regression showing the posterior probability of each one of the three scenarios. a) b)
