Overview Purpose To use mass spectrometric analysis to investigate cyanobacteria - cyanophage
advertisement
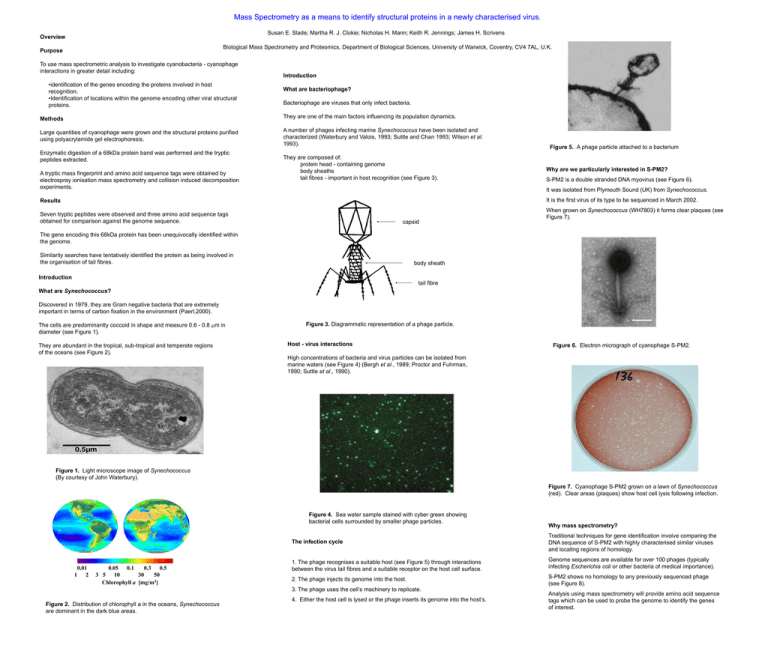
Mass Spectrometry as a means to identify structural proteins in a newly characterised virus. Susan E. Slade; Martha R. J. Clokie; Nicholas H. Mann; Keith R. Jennings; James H. Scrivens Overview Biological Mass Spectrometry and Proteomics, Department of Biological Sciences, University of Warwick, Coventry, CV4 7AL, U.K. Purpose To use mass spectrometric analysis to investigate cyanobacteria - cyanophage interactions in greater detail including: •identification of the genes encoding the proteins involved in host recognition. •Identification of locations within the genome encoding other viral structural proteins. Introduction What are bacteriophage? Bacteriophage are viruses that only infect bacteria. Methods They are one of the main factors influencing its population dynamics. Large quantities of cyanophage were grown and the structural proteins purified using polyacrylamide gel electrophoresis. A number of phages infecting marine Synechococcus have been isolated and characterized (Waterbury and Valois, 1993; Suttle and Chan 1993; Wilson et al. 1993). Enzymatic digestion of a 68kDa protein band was performed and the tryptic peptides extracted. A tryptic mass fingerprint and amino acid sequence tags were obtained by electrospray ionisation mass spectrometry and collision induced decomposition experiments. They are composed of: protein head - containing genome body sheaths tail fibres - important in host recognition (see Figure 3). Figure 5. A phage particle attached to a bacterium Why are we particularly interested in S-PM2? S-PM2 is a double stranded DNA myovirus (see Figure 6). It was isolated from Plymouth Sound (UK) from Synechococcus. It is the first virus of its type to be sequenced in March 2002. Results Seven tryptic peptides were observed and three amino acid sequence tags obtained for comparison against the genome sequence. capsid When grown on Synechococcus (WH7803) it forms clear plaques (see Figure 7). The gene encoding this 68kDa protein has been unequivocally identified within the genome. Similarity searches have tentatively identified the protein as being involved in the organisation of tail fibres. body sheath Introduction tail fibre What are Synechococcus? Discovered in 1979, they are Gram negative bacteria that are extremely important in terms of carbon fixation in the environment (Paerl,2000). The cells are predominantly coccoid in shape and measure 0.6 - 0.8 m in diameter (see Figure 1). They are abundant in the tropical, sub-tropical and temperate regions of the oceans (see Figure 2). Figure 3. Diagrammatic representation of a phage particle. Host - virus interactions Figure 6. Electron micrograph of cyanophage S-PM2. High concentrations of bacteria and virus particles can be isolated from marine waters (see Figure 4) (Bergh et al., 1989; Proctor and Fuhrman, 1990; Suttle et al., 1990). Figure 1. Light microscope image of Synechococcus (By courtesy of John Waterbury). Figure 7. Cyanophage S-PM2 grown on a lawn of Synechococcus (red). Clear areas (plaques) show host cell lysis following infection. Figure 4. Sea water sample stained with cyber green showing bacterial cells surrounded by smaller phage particles. 0.01 1 2 0.05 0.1 0.3 0.5 3 5 10 30 50 Chlorophyll a [mg/m3] The infection cycle Traditional techniques for gene identification involve comparing the DNA sequence of S-PM2 with highly characterised similar viruses and locating regions of homology. 1. The phage recognises a suitable host (see Figure 5) through interactions between the virus tail fibres and a suitable receptor on the host cell surface. Genome sequences are available for over 100 phages (typically infecting Escherichia coli or other bacteria of medical importance). 2. The phage injects its genome into the host. S-PM2 shows no homology to any previously sequenced phage (see Figure 8). 3. The phage uses the cell’s machinery to replicate. Figure 2. Distribution of chlorophyll a in the oceans, Synechococcus are dominant in the dark blue areas. Why mass spectrometry? 4. Either the host cell is lysed or the phage inserts its genome into the host’s. Analysis using mass spectrometry will provide amino acid sequence tags which can be used to probe the genome to identify the genes of interest. K T4 24.3 24 segD 23 22 21 68 67 20 19 18 17 16 15 14 13 wac 12 11 46 47 55 uvsW uvsY 3 23 22 21 20 19 18 17 16 15 14 13 wedge 21 kb Analysis by mass spectrometry (continued) W V Y G S A G S A A V I A T A yMax 1552.84 100 Suitable peptides for collision induced decomposition (CID) experiments were isolated using the first quadrupole and allowed into the collision cell. Instrumental conditions for CID analysis: •Mass range 50-2400 m/z •Argon collision gas •Collision energy 18-45eV (sample dependent) 776.42 1549.72 % 775.44 72 kb Product ion spectra were processed using the MaxEnt3 deconvolution algorithm prior to de novo sequencing to derive an amino acid sequence tag. Figure 8. Comparison of S-PM2 and E. coli T4 genetic organisation in the head and tail assembly region. Methods The DNA genome sequence was translated into potential amino acid sequences in all six reading frames. The sequence tags produced by CID experiments were compared against the hypothetical phage protein complement to identify the gene encoding each sample protein. 867.45 954.49 y8 y9 371.10 333.19 y2 244.14 147.11 b3 291.04 y1 445.13 527.32 b6 598.38 b7 739.39 777.26 y6 1554.17 1096.57 y11 944.49 1025.53;y10 900.49 b11 959.51 1195.62 1549.21 y12 1219.67 1308.71 b14 y13 1440.73 1554.55 1561.23 0 M/z 100 200 300 400 500 600 700 800 900 1000 1100 1200 1300 1400 1500 Figure 11. MaxEnt3 processed product ion spectrum of [M+2H] 2+ precursor ion 776.36 including amino acid assignments. Results Cyanophage growth, purification and protein separation RQN Cultures containing 1L of Synechococcus (7803) were grown under ambient conditions using artificial sea water. During the exponential growth phase, S-PM2 was added in a ratio of 1 phage particle : 1 bacterial cell. DLP VP P I D E T AF 100 Phage protein isolation and purification yMax 1711.84(M+H) + 1035.56 y9 The cyanophage structural proteins were successfully resolved using SDSPAGE analysis (see Figure 9). % Following bacterial cell lysis, sodium chloride was added to precipitate cell debris, which was then removed during centrifugation. The phage particles were precipitated using cold acetone at -20oC 677.31 b6 68 kDa overnight. 659.30 291.04 122.08 144.06 68kDa Following centrifugation to harvest the phage particles were resuspended in protein extraction buffer. 172.88 417.19 y3 200 400 518.26 546.22 1709.89 742.38 y6 856.65 839.41 861.42 970.49 b9 1713.47 1036.53 1148.63 y10 1317.56 1392.70 y12 1478.76 1566.74 1693.84 0 1715.07 M/z 600 800 1000 1200 1400 1600 Figure 12. MaxEnt3 processed product ion spectrum of [M+2H] 2+ precursor ion 856.40 including amino acid assignments. Samples were boiled in sodium dodecyl sulphate (SDS) loading buffer for 10 minutes and loaded onto a 10% polyacrylamide gel. Conclusions The gel was electrophoresed at 150V for 2 hours. The gel was visualised using either Coomassie Brilliant Blue or silver stain dependent on sample loading. Figure 9. Silver and Coomassie blue stained polyacrylamide gels showing purified cyanophage structural proteins It is extremely difficult to produce sufficient quantities of purified cyanophage proteins to perform CID experiments (1011 phage per sample). Seven tryptic peptide masses were obtained and three amino acid sequence tags. Analysis of tryptic peptides Sample preparation for analysis by mass spectrometry Coomassie stained protein bands were excised from the gel and cut into small pieces (~2mm3). Seven tryptic peptides were detected following digestion of the 68kDa protein band. Three were selected for CID experiments, yielding the amino acid sequence tags TTGASA(I/L), VAASGAS and (I/L)P(PV or VP), see Table 1 and Figures 1012. Gel pieces were washed sequentially with 50mM ammonium bicarbonate pH 8.0 and acetonitrile at least three times. A comparison of the expressed sequence tags with the genome identified the region encoding this protein as ORF 27. Gel pieces were dried at ambient temperature in a vacuum centrifuge. Tryptic peptide theoretical Mr Mr detected Amino Acid Sequence Tag Amino acid residue # Amino acid sequence of ORF 27 The protein was reduced with 10mM dithiothreitol and alkylated with 100mM iodoacetamide. 1164.56 1550.81 1164.54 1550.72 TTGASA(I/L) VAASGAS 210-222 275-290 SSTTGASALGDAK ATAIVAASGASGYVWK 1602.85 1602.76 - 621-634 AADQIEDIKLVIEF 1686.88 1686.84 - 368-383 IVVSGGQIESTEVVDR 1710.86 1710.80 (I/L)P(PV or VP) 140-154 FATEDIPPVPLDNQR 2083.94 2083.90 - 255-274 TNPSGGEGTYNPSTGIFTER 2473.24 2473.20 - 502-526 IQNATAGFVADEEITQNLAGGGVAK Gel pieces were sequentially washed with acetonitrile and 50mM ammonium bicarbonate pH 8.0 at least twice. Gel pieces were dried at ambient temperature in a vacuum centrifuge and rehydrated in a solution containing 10ngml-1 trypsin in 50mM ammonium bicarbonate pH 8.0 on ice for 40 minutes. The identification has enabled more specific searches to be carried out with known phage genomes. Thus, due to similarity at the C terminal end with the protein from the T4 E. coli phage, we have tentatively identified our protein as being involved in the organisation of tail fibres. Most importantly we hope to identify the tail fibre proteins involved in host specificity. We can then carry out a range of genetic and molecular biological experiments to determine the exact nature of this phage – cyanobacteria interaction. Mass spectrometry has given us the starting point from which to try to understand this fascinating problem. Table 1. Comparison of theoretical and detected tryptic masses from 68kDa protein. Sequence tags with corresponding genome sequence from ORF 27 are also shown. The peptides were freeze-dried and resuspended in 2% formic acid. K A D G L A 100 Each sample was desalted prior to analysis using a C18 ZipTip (Millipore Corporation, Bedford, U.S.A.) according to the manufacturer’s instructions except the peptides were eluted with 60% acetonitrile containing 1% formic acid. 583.29 S A G T T SS References: Bergh, O., Borsheim K.Y., Bratbak, G. et al (1989). High abundance of viruses found in aquatic environments. Nature 340 (6233): 467-468 yMax Paerl, H. W. (2000). Chapter 5 Marine Plankton. In The ecology of cyanobacteria: their diversity in Time and Space. Ed. Whitton, B. A., and Potts, M. Kluwer Academic Publishers, Amsterdam. Proctor, I. M. and Fuhrman, J. A. (1990). Viral mortality of marine-bacteria and cyanobacteria. Nature 343 (6253): 60-62 582.34 Suttle, C. A., Chan, A.M. and Cottrell, M. T. (1990). Infection of phytoplankton by viruses and reduction of primary productivity. Nature 347 (6292): 467-469 % Analysis by mass spectrometry 789.42 y9 133.08 All samples were analysed using a Q-Tof mass spectrometer (Micromass, Manchester,U.K.) fitted with a nanoflow (NF) capillary infusion inlet. Calibration was achieved using a solution of sodium iodide. 89.06 218.15 y2 175.11;b2 258.12 661.35 y7 359.15 390.20 y4 503.28 565.26 y5 425.18 584.43 613.05 890.47 y10 732.40 y8 973.49 1073.54 1055.54 801.89 100 200 300 400 500 600 700 800 900 Suttle, C. A. and Chan, A. M. (1993). Marine cyanophages infecting oceanic and coastal strains of Synechococcus - abundance, morphology, cross-infectivity and growth-characteristics. Mar. EcolProg. Ser. 92 (1-2): 99-109 1165.16 955.48 680.34 1167.59 1111.53 0 Instrumental conditions for MS analysis: NF capillary (Protana Engineering, Sweden) voltage 1000V •Cone voltage 40V •Scan time 2.4sec •Mass range 400-2400 m/z From the data obtained, we have unequivocally identified the gene in the S-PM2 genome (ORF 27), which codes for the 68 kDa protein. The procedure will be repeated on the remaining viral structural proteins and we hope to determine where proteins involved in the capsid and tail fibres are coded for in the genome of S-PM2. Each tryptic digestion was incubated at 37oC for 20 hours. Peptides were extracted three times with a solution containing H2O/acetonitrile/formic acid (50/50/5 v/v/v). The sequence tags obtained searched against the genome and the matching sequences identified . 1000 1100 1186.60 1195.61 M/z 1200 Figure 10. MaxEnt3 processed product ion spectrum of [M+2H] 2+ precursor ion 583.27 including amino acid assignments. Waterbry, J. B. and Valois F. W. (1993). Resistance to co-occurring phages enables marine Synechococcus communities to coexist with cyanophages abundant in seawater. Appl. Environ. Micro. 59 (10): 3393-3399 Wilson, W. H., Joint I. R. Carr, N. G. et al (1993). Isolation and molecular characterization of five marine cyanophages propagated on Synechococcus sp. strain WH7803. Appl. Environ. Micro. 59 (11): 3736-3743
