Molecular physics of a polymer engineering instability: experiments and computation
advertisement
Molecular physics of a polymer engineering instability: experiments and computation
D. G. Hassell and M. R. Mackley
Department of Chemical Engineering, University of Cambridge, CB2 3RA, UK
M. Sahin∗ and H. J. Wilson†
Mathematics Department, University College London, Gower Street, London WC1E 6BT, UK
1
2
O. G. Harlen1 and T. C. B. McLeish2
School of Mathematics; Polymer IRC, School of Physics & Astronomy, University of Leeds, Leeds LS2 9JT, UK
Entangled polymer melts exhibit a variety of flow instabilities that limit production rates in
industrial applications. We present both experimental and computational findings, using flow of
monodisperse linear polystyrenes in a contraction–expansion geometry, which illustrate the formation and development of one such flow instability. This viscoelastic disturbance is first observed at
the slit outlet and subsequently produces large-scale fluid motions upstream. A numerical linear
stability study using the molecular structure based Rolie-Poly model confirms the instability and
identifies important parameters within the model, which gives physical insight into the underlying
mechanism. Chain stretch was found to play a critical role in the instability mechanism, which
partially explains the effectiveness of introducing a low-molecular weight tail into a polymer blend
to increase its processability.
PACS numbers: 47.15.Fe 47.20.Gv 47.50.Gj 47.57.Ng 83.50.Uv 83.60.Wc
There are numerous types of experimentally observed
instability in polymer melt flow; a recent review [1] highlights three forms observed in extrusion that occur at
increasing rates of flow. The first two are “sharkskin”
instabilities, which develop due to free surface effects,
and “stick-spurt” or “stick-slip” instabilities, which result from material compression and stick-slip at the wall.
While the mechanisms underlying the formation of these
first two are relatively well understood [2, 3], the third
class, termed “volume instability”, is less so [4]. This
instability in converging flows for extrusion and injection moulding has been known for many years, and an
empiricism has been developed. But as yet there is no
understanding of the underlying physics of the problem,
and the inherent connection between the viscoelastic instability and the molecular polymer dynamics. Understanding the underlying physical process would greatly
enhance industry’s ability to define efficient processing
conditions.
This letter outlines recent work in which we created an
idealised model flow, related to the engineering flows in
that the essential elements are present, but simplified so
that the experimental variables are well-controlled and so
the whole flow field can be modelled. We have use molecularly well-characterised materials (building on previous
work for monodisperse materials under tightly controlled
flow conditions [5, 6]) so that the connection between viscoelastic properties and molecular structure can be maintained without empirical fitting. Through these careful
∗ Current
address: Department of Aerospace Engineering Sciences,
University of Colorado, Boulder, Colorado, 80309, USA
† Electronic address: helen.wilson@ucl.ac.uk
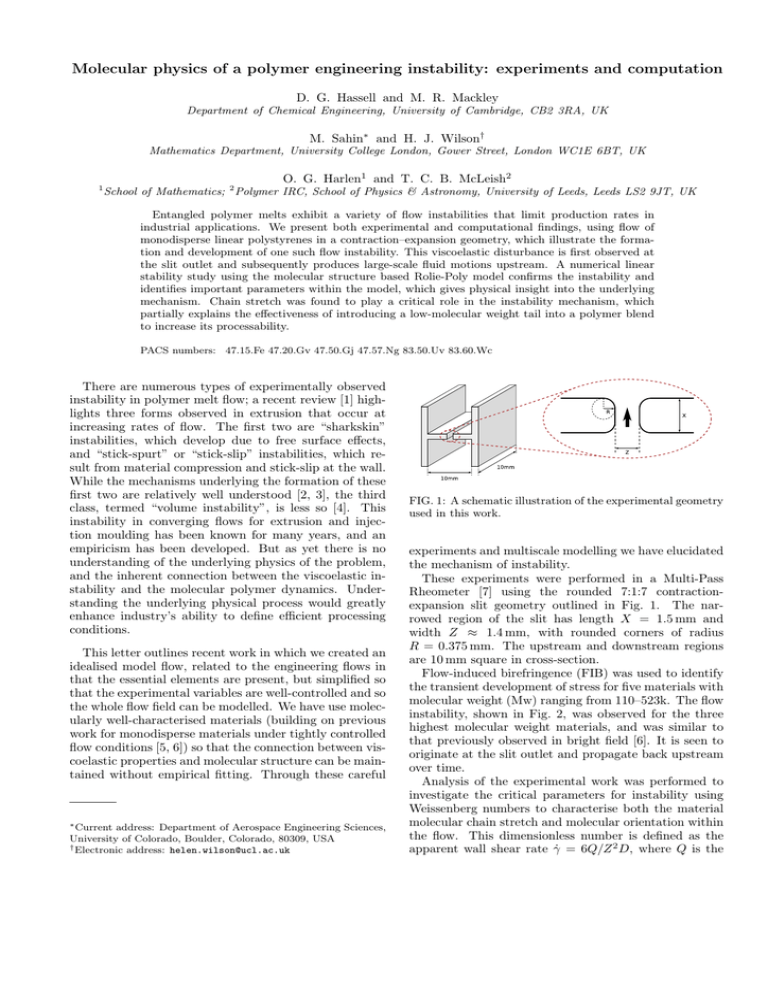
FIG. 1: A schematic illustration of the experimental geometry
used in this work.
experiments and multiscale modelling we have elucidated
the mechanism of instability.
These experiments were performed in a Multi-Pass
Rheometer [7] using the rounded 7:1:7 contractionexpansion slit geometry outlined in Fig. 1. The narrowed region of the slit has length X = 1.5 mm and
width Z ≈ 1.4 mm, with rounded corners of radius
R = 0.375 mm. The upstream and downstream regions
are 10 mm square in cross-section.
Flow-induced birefringence (FIB) was used to identify
the transient development of stress for five materials with
molecular weight (Mw) ranging from 110–523k. The flow
instability, shown in Fig. 2, was observed for the three
highest molecular weight materials, and was similar to
that previously observed in bright field [6]. It is seen to
originate at the slit outlet and propagate back upstream
over time.
Analysis of the experimental work was performed to
investigate the critical parameters for instability using
Weissenberg numbers to characterise both the material
molecular chain stretch and molecular orientation within
the flow. This dimensionless number is defined as the
apparent wall shear rate γ̇ = 6Q/Z 2 D, where Q is the
2
(a)
60
110k, 140C
210k, 164C
306k, 165C
306k, 170C
488k, 180C
523k, 170C
523k, 180C
50
Stable
40
τd
τR
30
Stable
20
Unstable
Stable
10
(b)
Unstable
0
0.1
1
10
100
WeR = γ̇τR
Flow
FIG. 2: FIB images of the 488k Mw material at 180o C, illustrating elements of the flow instability. The images are
presented at two sequential times (a) and (b), half an oscillation period apart. At each time a magnified downstream
image is shown on the right. Static photographs alone do not
capture the form of the instability well; the detailed form is
much more evident from observing a video sequence. The disturbance is first observed downstream of the contraction, and
manifests as an oscillation of the fringe pattern perpendicular
to the bulk flow; this is characterised by lateral movement of
the elliptical zero stress eye, seen in the images on the right. It
then propagates upstream and influences the upstream stress
pattern, producing oscillations similar to those seen downstream. Flow is from left to right. Apparent wall shear rate
γ̇ = 3.6 s−1 ; Weissenberg numbers WeR = 1.6, Wed = 73.
volumetric flow rate, multiplied by either the Rouse time
(τR ) for molecular chain relaxation, WeR = γ̇τR or the
reptation time (τd ) for molecular orientation relaxation,
Wed = γ̇τd . The ratio of these numbers, τd /τR , is a function of the polymer molecular weight. A Weissenberg
number above one corresponds to chain stretch (for WeR )
or molecular orientation (for Wed ) within the flow. In
this study flow instabilities were only observed at flow
rates where both Weissenberg numbers were above one.
Temperature was used as a variable parameter to process
the different molecular weight materials at similar τd and
τR to determine any clear trend for instability onset in
relation to these two relaxation times. Example results
are shown in Fig. 3, which plots the parameter space of
molecular weight, represented by τd /τR , and the material deformation defined by WeR . It illustrates the region
in which instabilities are observed, and clearly highlights
that for low ratios of τd /τR the instabilities are not observed even at high rates of deformation in this flow geometry. From this and a similar plot of τd /τR against
Wed , there is no simple criterion for instability in terms
FIG. 3: Processing stability map of the ratio of relaxation
times with respect to Rouse time Weissenberg number highlighting the parameter space in which instabilities were observed. Solid symbols represent unstable flows.
of one critical Weissenberg number WeR or Wed .
Numerical modelling focussed on the linear stability properties of the flowing system, in which the base
flow was assumed to be two-dimensional and stability to
three-dimensional perturbations was studied. Although
linear stability is not guaranteed to identify all instabilities (some viscoelastic instabilities are inherently nonlinear [8]), experiments suggest that the melt instability we are pursuing does have linear onset. We model
the polymer using the Rolie-Poly model [9], currently
the most advanced differential formulation of the Doi–
Edwards tube model for linear polymer melts that is also
compact enough to be computable in finite element complex flow calculations. It incorporates at the level of two
modes per chain the processes of reptation, convective
constraint release (CCR) [10], chain stretch and retraction. We use a multimode version incorporating a solvent
viscosity term (without inertia):
X
∇ · u = 0; − ∇p + η∇2 u +
Gi ∇ · σi = 0
(1)
i
−1
Dσi /Dt = κ · σi + σi · κ> − τd,i
(σi − I)
³
´
−1/2
−1/2
−1
(1 − Si
− 2τR,i
) σi + β ∗ Si
(σi − I)
(2)
in which u is the fluid velocity, p pressure, κ the velocity gradient, and 3Si is the trace of the polymer stress
tensor σi for each mode. The physical parameters are η
(effective solvent viscosity), Gi (modulus of each mode),
τR,i (Rouse time for each mode), τd,i (reptation time for
each mode) and β ∗ (CCR parameter).
We considered three levels of numerical modelling for
each material: [A] the simplest model, a single RoliePoly mode with no solvent viscosity; [B] a single RoliePoly mode with solvent viscosity; and [C] solvent viscosity plus two Rolie-Poly modes. In each case the values
3
of the physical parameters were obtained, as in earlier
studies [5, 11], from fitting to the full Likhtman–McLeish
model [12] of the chosen molecular weight linear polymer.
The steady base flow was found using a semi-staggered
finite volume method, similar to earlier work [13] but using Newton’s method rather than time-dependent calculation. If the underlying flow is unstable, time-dependent
simulations will never find a steady state. Similar timedependent calculations have been carried out by Alves &
coworkers using the PTT model [14]. To calculate the
stability properties of this solution, we linearised equations (1–2) for small (lower case) perturbations about
the (upper case) base solution Φ(x, y, z, t) = Φ0 (x, y) +
φ(x, y) exp [ikz + ωt]. The solution vector Φ consists of
all the flow variables {u, p, σi }. The linearisation results
in a generalized eigenvalue problem for φ(x, y) and ω:
ωφ(x, y) = L(Φ0 (x, y); ∂x , ∂y , k)φ(x, y)
in which L is a linear operator acting on the perturbation
φ. This is a standard technique; Smith et al. [15] have
applied it to viscoelastic systems using a finite-element
solver for the base flow. We solve the linear system by the
shift-invert Arnoldi method, looking for the eigenvalues
with largest real part, and the system is unstable if one or
more eigenvalue has a positive real part. The numerical
method is described more fully in [16]; the results we
present here are robust to mesh refinement. The period of
oscillation of an unstable mode is given by 2π/Im(ω) and
the wavelength in the out-of-plane direction by λ = 2π/k.
Both the experimental 7:1:7 and benchmark 8:1:8
contraction-expansion geometries were modelled using a
two-dimensional mesh, and their results are essentially
equivalent. In each case the inlet and outlet regions have
length 17mm with periodic boundary conditions connecting the two ends. The highest molecular weight material (523k Mw, with [A] relaxation times τR ≈ 1 s and
τd ≈ 53 s at 170o C) was used as a case study material for
numerical modelling. Its parameters [C] are:
G1
τd,1
τR,1
η
=
=
=
=
1.132 × 10⁵ Pa
27.1 s
0.4907 s
9894 Pa s
G2
τd,2
τR,2
β∗
=
=
=
=
42250 Pa
2.17 s
0.1356 s
0.283
With this technique an instability was found at a reptation Weissenberg number γ̇τd,1 = 120, corresponding to
an apparent wall shear rate of γ̇ ≈ 4.4 s−1 . The same experimental instability was observed at an apparent wall
shear rate of γ̇ ≈ 1.9 s−1 . Partial explanations for this
discrepancy are that the numerical study does not exactly capture the lowest unstable flow rate γ̇c but instead
simply demonstrates instability at some flow rate γ̇ > γ̇c ;
or from three-dimensional effects (as the numerical study
assumes a channel of infinite depth).
We shifted all timescales and moduli to the experimental temperature of 180o C by standard WLF shifting, using WLF parameters for PS taken from the literature [17, 18]; with this method the instability onset at
180o C is predicted to be at γ̇ ≈ 12 s−1 compared with
the experimental observation of γ̇ ≈ 3.6 s−1 ; note that
time-temperature superposition does not work perfectly
on the experimental critical flow rate (the result at 170o C
would suggest a critical apparent wall shear rate at 180o C
closer to γ̇ ≈ 9.8 s−1 ) so we would not expect a perfect
match between idealised numerical calculations and the
experiments. Nonetheless these results are impressive:
no artifical adjustments of parameters have been made
here, and these calculations are really ab initio predictions. However, stability results can depend in subtle
ways on constitutive details [19] so it is still possible that
our computational results are specific to the Rolie-Poly
equation. Nonetheless, our prediction of critical flow rate
is relatively good, particularly at 170o C, as is the form
of the unstable flow, as we shall see later.
The wavelength of the numerically calculated unstable
perturbation in the out-of-plane direction is λ = 44 mm,
much longer than any of the characteristic lengthscales
of the problem, including the experimental slit depth.
In essence, we would expect to see exactly the same
mode of instability if we were to consider a perturbation entirely in the plane of flow (equivalent to a perturbation having infinite λ and hence two-dimensional
flow). This makes it unlikely that the mechanism of instability is related to the interaction of normal stresses
with curved streamlines [20], as that well-characterised
instability is fully three-dimensional. A recent paper by
Alves & Poole [21] uses scaling laws based on the curved
streamline mechanism to explain a steady, purely twodimensional “divergent flow” phenomenon in a smooth
contraction–expansion flow; we believe that the oscillatory instability we observe is qualitatively different and
derives from a different physical mechanism.
Fig. 4(a) shows streamlines for the perturbation flow
just above the critical We. The shading represents the
flow in the direction of the base flow: this is asymmetric across the slit, indicating a circulation region just
downstream of the contraction. It is the effect of this
circulation on the zero-birefringence point in the flow
that causes the experimentally observed “side-to-side”
motion.
The period of oscillations predicted by the numerical
study at 170o C is around 19 s, which corresponds well
with the value of ≈ 13 s seen just above the critical experimental Weissenberg number. The flow-component of
the extra stress from the first Rolie-Poly mode, which
is the dominant mode in this flow, is illustrated for the
unstable perturbation in Fig. 4(b). This, too, is antisymmetric across the channel, and the largest changes
in both stress and vertical velocity due to the instability
occur just downstream of the contraction, where the experimental instabilities are first observed. From this we
conclude that the instabilities observed by our numerical technique are physical, as they relate directly to the
experimental results.
In order to elucidate the mechanism of the instability, the computational code was applied to a simpler [B]
4
(a)
(b)
FIG. 4: The unstable perturbation flow for the two-modes
plus solvent Rolie-Poly model of the 523k Mw fluid at 170o C,
with γ̇τd,1 = 120 and k = 0.1. (a) Streamlines, and shading
representing the velocity in the principal flow direction; note
the strong circulation region just downstream of the contraction. (b) Plot of the perturbation to the xx component of the
first (dominant) Rolie-Poly mode. Note again the dominant
region downstream of the contraction.
version of the 523k Mw fluid:
in line with the experiments, this instability is inherent
to entangled melts — i.e. to those with stretch and orientation processes on different timescales. Secondly, we
believe that the critical physical phenomenon for instability is the amount of chain stretch (whose relaxation is enhanced by decreasing τR or by increasing the convective
constraint release by increasing β ∗ ). This mechanism is
supported by the experimental observations that materials with a low ratio τd /τR , in which relatively little chain
stretch occurs, are stable even at high flow rates. If the
molecular weight is too low, such that the chain stretch
relaxes on a timescale similar to orientation; or in the
presence of too much convective constraint release, then
the observed instability does not manifest itself. These
results are a step towards a physical explanation for the
effectiveness of introducing a low-molecular weight additive into a polymer to increase its processability [6].
These molecules effectively increase convective constraint
release of longer molecular weight chains thereby reducing their chain stretch at a specific flow-rate. The use
of molecular constitutive equations of increasing sophistication together with stability analysis of complex flow
geometries will enable rational process design to avoid
unstable viscoelastic flows.
G = 1.104 × 10⁵ Pa, η = 3.070 × 10⁴ Pa s,
τd = 27.1 s,
τR = 0.678 s,
β ∗ = 1,
for which no instability was found. Probing the numerical parameter space revealed that instability could be
provoked either by increasing τd /τR by a factor of 20
(consistent with the trends of Fig. 3, but which would
correspond to a much higher Mw than the first unstable experimental material) or (much more realistically)
by reducing the CCR parameter β ∗ to its [C] value of
0.283. This observation leads us to believe firstly that,
[1] J.-F. Agassant, D. R. Arda, C. Combeaud, A. Merten,
H. Munstedt, M. R. Mackley, L. Robert, and B. Vergnes,
IPP 21, 239 (2006).
[2] A. Allal, A. Lavernhe, B. Vergnes, and G. Marin, JNNFM 134, 127 (2006).
[3] M. Ranganathan, M. R. Mackley, and P. H. J. Spitteler,
J. Rheol. 43, 443 (1999).
[4] C. Combeaud, Y. Demay, and B. Vergnes, JNNFM 121,
175 (2004).
[5] M. W. Collis, A. K. Lele, M. R. Mackley, R. S. Graham,
D. J. Groves, A. E. Likhtman, T. M. Nicholson, O. G.
Harlen, T. C. B. McLeish, L. R. Hutchings, et al., J.
Rheol. 49, 501 (2005).
[6] M. W. Collis and M. R. Mackley, JNNFM 128, 29 (2005).
[7] M. R. Mackley, R. T. J. Marshall, and J. B. A. F. Smeulders, J. Rheol. 39, 1293 (1995).
[8] B. Meulenbroek, C. Storm, V. Bertola, C. Wagner,
D. Bonn, and W. van Saarloos, PRL 90, 024502 (2003).
[9] A. E. Likhtman and R. S. Graham, JNNFM 114, 1
(2003).
[10] G. Marrucci, JNNFM 62, 279 (1996).
Acknowledgments
DGH and MRM thank Simon Butler for technical
assistance and Lian Hutchings and Dow for materials.
HJW and MS acknowledge the use of UCL Research
Computing facilities (Altix). All authors thank John
Embery and Richard Graham. This work was funded
through the µPP2 project, EPSRC GR/T11807/01.
[11] J. Bent, L. R. Hutchings, R. W. Richards, T. Gough,
R. Spares, P. D. Coates, I. Grillo, O. G. Harlen, D. J.
Read, R. S. Graham, et al., Science 301, 1691 (2003).
[12] A. E. Likhtman and T. C. B. McLeish, Macromolecules
35, 6332 (2002).
[13] M. Sahin and H. J. Wilson, JNNFM 147, 79 (2007).
[14] M. A. Alves, P. J. Oliveira, and F. T. Pinho, JNNFM
122, 117 (2004).
[15] M. D. Smith, R. C. Armstrong, R. A. Brown, and
R. Sureshkumar, JNNFM 93, 203 (2000).
[16] M. Sahin and H. J. Wilson, JNNFM (2008),
doi:10.1016/j.jnnfm.2008.01.004.
[17] J. D. Ferry, Viscoelastic Properties of Polymers (Wiley,
1980).
[18] A. E. Likhtman, Macromolecules 38, 6128 (2005).
[19] A. M. Grillet, A. B. Bogaerds, G. W. M. Peters, F. P. T.
Baaijens, and M. Bulters, J. Rheol. 46, 651 (2002).
[20] P. Pakdel and G. H. McKinley, PRL 77, 2459 (1996).
[21] M. A. Alves and R. J. Poole, JNNFM 144, 140 (2007).
![[These nine clues] are noteworthy not so much because they foretell](http://s3.studylib.net/store/data/007474937_1-e53aa8c533cc905a5dc2eeb5aef2d7bb-300x300.png)

