Decision Tree Approach in Blood Bank Data with Weka Tools
advertisement

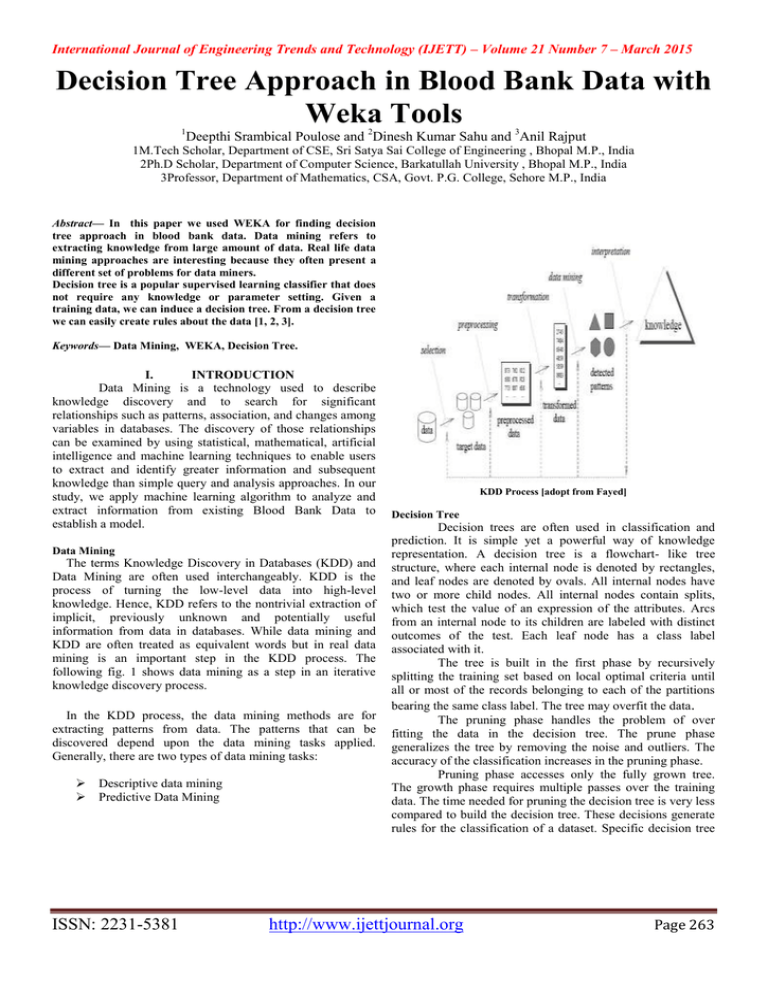
International Journal of Engineering Trends and Technology (IJETT) – Volume 21 Number 7 – March 2015 Decision Tree Approach in Blood Bank Data with Weka Tools 1 Deepthi Srambical Poulose and 2Dinesh Kumar Sahu and 3Anil Rajput 1M.Tech Scholar, Department of CSE, Sri Satya Sai College of Engineering , Bhopal M.P., India 2Ph.D Scholar, Department of Computer Science, Barkatullah University , Bhopal M.P., India 3Professor, Department of Mathematics, CSA, Govt. P.G. College, Sehore M.P., India Abstract— In this paper we used WEKA for finding decision tree approach in blood bank data. Data mining refers to extracting knowledge from large amount of data. Real life data mining approaches are interesting because they often present a different set of problems for data miners. Decision tree is a popular supervised learning classifier that does not require any knowledge or parameter setting. Given a training data, we can induce a decision tree. From a decision tree we can easily create rules about the data [1, 2, 3]. Keywords— Data Mining, WEKA, Decision Tree. I. INTRODUCTION Data Mining is a technology used to describe knowledge discovery and to search for significant relationships such as patterns, association, and changes among variables in databases. The discovery of those relationships can be examined by using statistical, mathematical, artificial intelligence and machine learning techniques to enable users to extract and identify greater information and subsequent knowledge than simple query and analysis approaches. In our study, we apply machine learning algorithm to analyze and extract information from existing Blood Bank Data to establish a model. Data Mining The terms Knowledge Discovery in Databases (KDD) and Data Mining are often used interchangeably. KDD is the process of turning the low-level data into high-level knowledge. Hence, KDD refers to the nontrivial extraction of implicit, previously unknown and potentially useful information from data in databases. While data mining and KDD are often treated as equivalent words but in real data mining is an important step in the KDD process. The following fig. 1 shows data mining as a step in an iterative knowledge discovery process. In the KDD process, the data mining methods are for extracting patterns from data. The patterns that can be discovered depend upon the data mining tasks applied. Generally, there are two types of data mining tasks: Descriptive data mining Predictive Data Mining ISSN: 2231-5381 KDD Process [adopt from Fayed] Decision Tree Decision trees are often used in classification and prediction. It is simple yet a powerful way of knowledge representation. A decision tree is a flowchart- like tree structure, where each internal node is denoted by rectangles, and leaf nodes are denoted by ovals. All internal nodes have two or more child nodes. All internal nodes contain splits, which test the value of an expression of the attributes. Arcs from an internal node to its children are labeled with distinct outcomes of the test. Each leaf node has a class label associated with it. The tree is built in the first phase by recursively splitting the training set based on local optimal criteria until all or most of the records belonging to each of the partitions bearing the same class label. The tree may overfit the data. The pruning phase handles the problem of over fitting the data in the decision tree. The prune phase generalizes the tree by removing the noise and outliers. The accuracy of the classification increases in the pruning phase. Pruning phase accesses only the fully grown tree. The growth phase requires multiple passes over the training data. The time needed for pruning the decision tree is very less compared to build the decision tree. These decisions generate rules for the classification of a dataset. Specific decision tree http://www.ijettjournal.org Page 263 International Journal of Engineering Trends and Technology (IJETT) – Volume 21 Number 7 – March 2015 methods include Classification and Regression Trees (CART) and Chi Square Automatic Interaction Detection (CHAID). == Run information === J48 Pruned Tree Scheme: weka.classifiers.trees.J48 -C 0.25 -M 2 Relation: bloodbankweka.filters.unsupervised.attribute.Remove-R3,7 Instances: 210 Attributes: 6 Donor_Type Economy Age Quantity Blood_Group BPL_CARD Test mode: evaluate on training data === Classifier model (full training set) === J48 is a module for generating a pruned or unpruned C4.5 decision tree. When we applied J48 onto refreshed data. II. DATA MINING TOOLS WEKA WEKA (The Waikato Environment for Knowledge Analysis) is an open-source Java application produced by the University of Waikato in New Zealand. This software package features an interface through which many of the aforesaid algorithms (including decision trees) can be utilized on preformatted data sets. Using this interface, several testdomains were experimented with to gain insight on the effectiveness of different methods of pruning an algorithmically induced decision tree. WEKA came about through the perceived need for a unified workbench that would allow researchers easy access to state-of the- art techniques in machine learning. Nowadays, WEKA is recognized as a landmark system in data mining and machine learning. It has achieved widespread acceptance within academia and business circles, and has become a widely used tool for data mining research. J48 pruned tree -----------------Age <= 45 | Blood_Group = AB+ | | Economy = Medium: Genral (11.0/4.0) | | Economy = High: Particular (4.0/2.0) | | Economy = LOW: Particular (2.0) | Blood_Group = O+ | | Age <= 29: Genral (34.0/7.0) III. Experimental Setup and result This section presents the detail description of | | Age > 29: Particular (6.0) experimental setup. In this account blood bank dataset is used . | Blood_Group = B+ Donar_type attribute has taken as a class attribute. | | BPL_CARD = NO: Genral (62.0/14.0) | | BPL_CARD = YES: Particular (2.0) | Blood_Group = B-: Particular (2.0) | Blood_Group = A+ | | Age <= 26 | | | Quantity <= 300: Genral (5.0) | | | Quantity > 300 | | | | Age <= 24: Particular (4.0/1.0) | | | | Age > 24 | | | | | Age <= 25: Genral (6.0/1.0) | | | | | Age > 25: Particular (2.0) | | Age > 26: Genral (11.0) | Blood_Group = A-: Particular (1.0) Age > 45 | Age <= 46: Paid (4.0) | Age > 46 | | Age <= 54: Genral (19.0) | | Age > 54 | | | Age <= 58 | | | | Age <= 57: Particular (4.0) | | | | Age > 57: Genral (12.0/4.0) | | | Age > 58: Genral (19.0) This attribute has three classes which named as particular, general and paid. We have used J48 Decision tree classifier for analyzing a blood bank data. Generated decision tree is given below. ISSN: 2231-5381 Number of Leaves : 19 Size of the tree : 32 Time taken to build model: 0.02 seconds === Evaluation on training set === Time taken to test model on training data: 0 seconds http://www.ijettjournal.org Page 264 International Journal of Engineering Trends and Technology (IJETT) – Volume 21 Number 7 – March 2015 [2] Soman, K.P., S. Diwakar and V. Ajay, 2006. “Insight into Data MiningTheory and Practice” Prentice Hall of India, New Delhi, ISBN: 81-203-28973. === Summary === Correctly Classified Instances 177 84.2857 % Incorrectly Classified Instances 33 15.7143 % Kappa statistic 0.5575 Mean absolute error 0.1588 Root mean squared error 0.2818 Relative absolute error 55.9084 % Root relative squared error 75.0712 % Coverage of cases (0.95 level) 98.5714 % Mean rel. region size (0.95 level) 55.0794 % Total Number of Instances [3] Rossen Dimov et al., Weka: Practical machine Learning Tools and Techniques -April 30, 2007. 210 === Detailed Accuracy By Class === F-Measure TP Rate FP Rate Precision Recall MCC ROC Area PRC Area Class 0.471 0.019 0.889 0.853 0.711 0.889 Particular 0.889 0.579 0.832 0.987 0.508 0.832 0.606 0.854 0.921 0.832 General 1.000 0.500 0.000 1.000 0.700 0.909 0.613 1.000 Paid Weighted Avg. 0.843 0.370 0.853 0.824 0.603 0.856 0.858 0.843 === Confusion Matrix === a b c <-- classified as 24 27 0 | a = Particular 2 149 0 | b = General 1 3 4 | c = Paid IV. CONCLUSION In this research paper we have described classification techniques for Blood Group Donors datasets. We have used data mining classifiers to generate decision tree. The future work can be applied to blood type classification. V. REFERENCES [1] Anil Rajput, Ramesh Prasad Aharwal, Nidhi Chandel, Devenra Singh Solanki and Ritu Soni “Approaches of Classifications to Policy of Analysis of Medical Data” IJCSNS International Journal of Computer Science and Network Security, VOL.9 No.11, November 2009,pp.01-09. ISSN: 2231-5381 http://www.ijettjournal.org Page 265


